Creating custom reports is easy. Just decide what data you want to include, follow our directions and you’re ready to go. Then use custom reports to gain insight into your website traffic and visitor journeys.
To create a custom report, follow these steps:
- Go to Menu > Analytics.
- Navigate to Custom reports.
- Click Add a report.
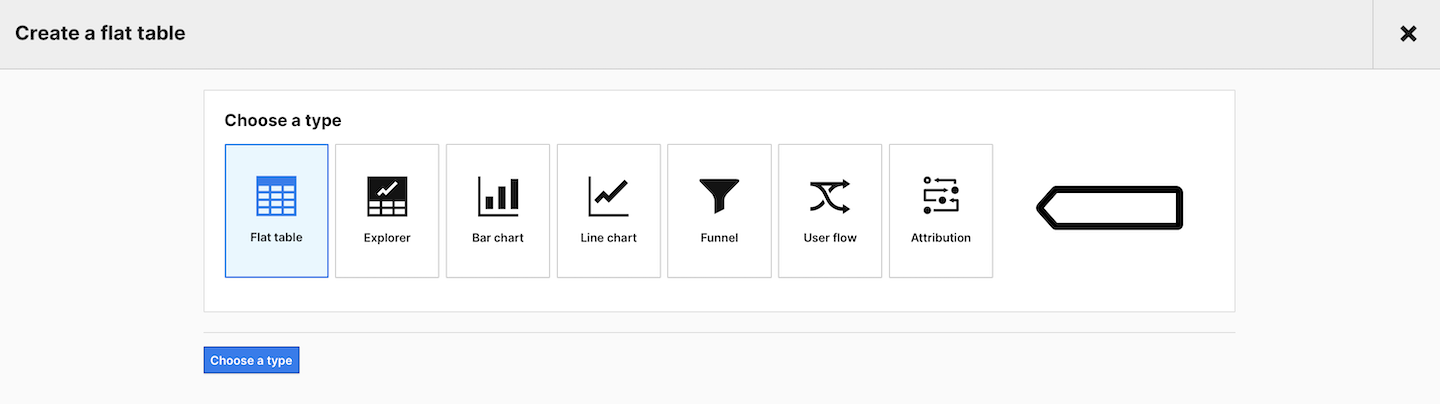
- Select the report you want to use. You can choose from the following types:
- Flat table: A simple table with dimensions and metrics, no nesting.
- Explorer: A table with nested dimensions and metrics, accompanied by a line chart.
- Bar chart: A graph with bars for easy data comparison.
- Line chart: A graph illustrating data changes over time.
- Funnel: A chart revealing the steps visitors take to complete a goal on your site or app, helping you identify drop-off points. Read more
- User flow: A visual representation of a visitor’s journey on your site or app, showcasing the pages they visit and their actions, aiding in pinpointing areas for improvement. Read more
- Attribution: A report displaying the impact of marketing channels or touchpoints on conversions and sales, guiding your marketing budget decisions for better results. Read more
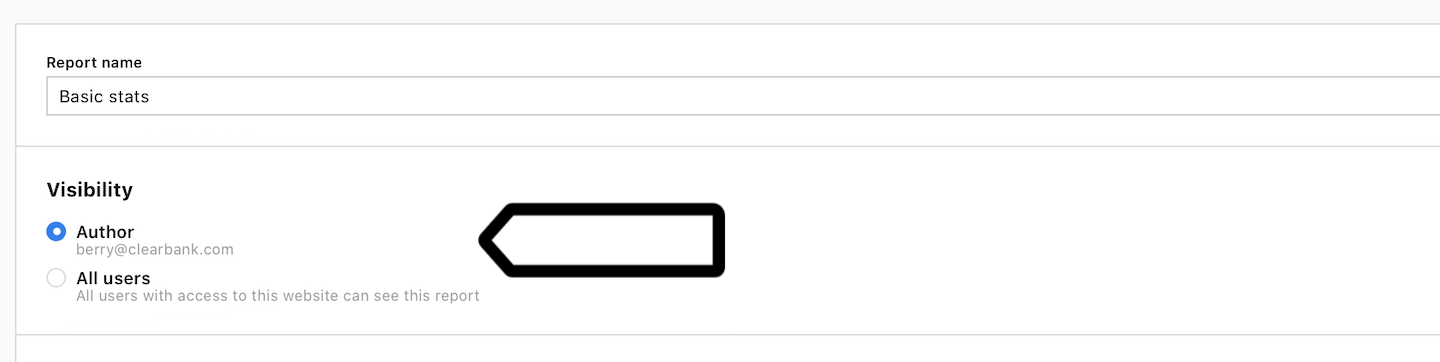
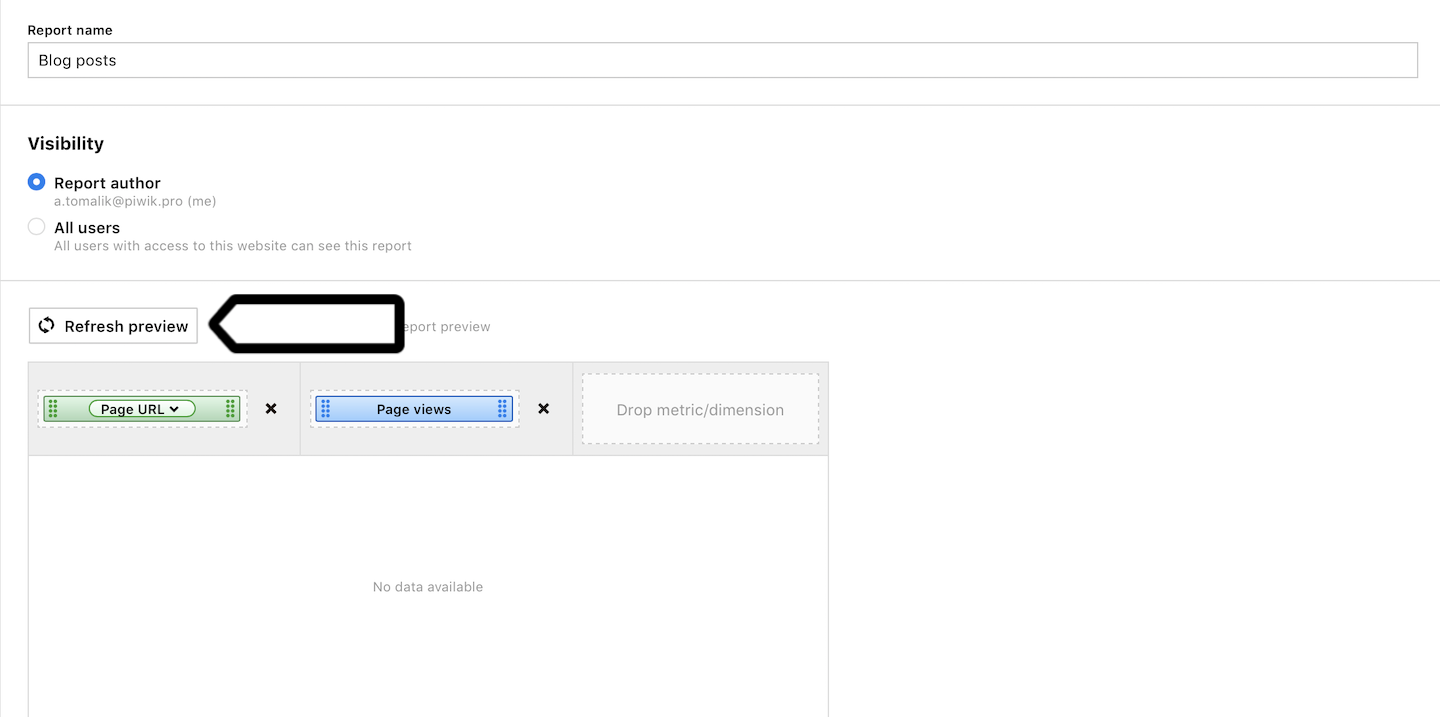
- Name the report.
- In Visibility, choose Author or All users. All users lets you share this report with your teammates.
- Choose dimensions and metrics for your report. Drag items from the right menu to the left drop area.
Note: Keep in mind that when you create a report, you can’t combine an event dimension with a metric calculated for a session dimension. They must be in the same scope. For more, see this article.
- (Optional) Set up Default sorting options.
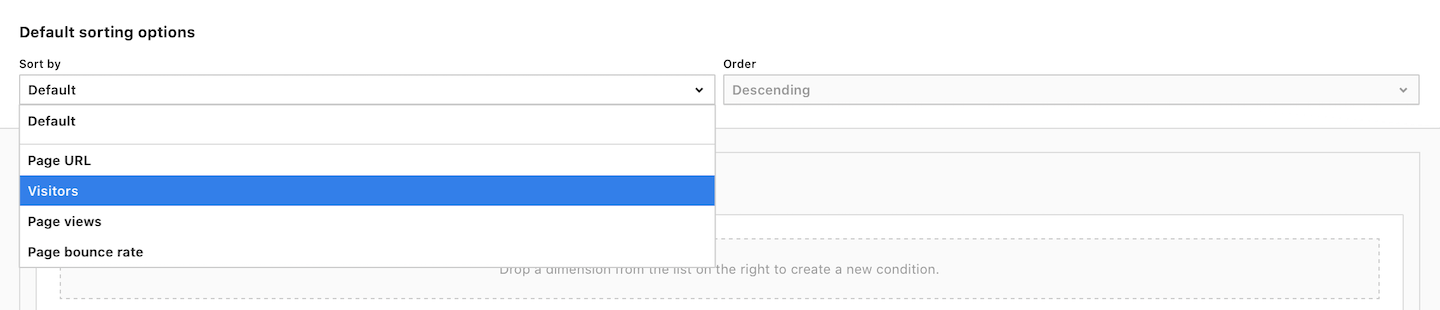
Tip: Default sorting makes the data appear in your report in a specific order based on the selected dimension or metric.
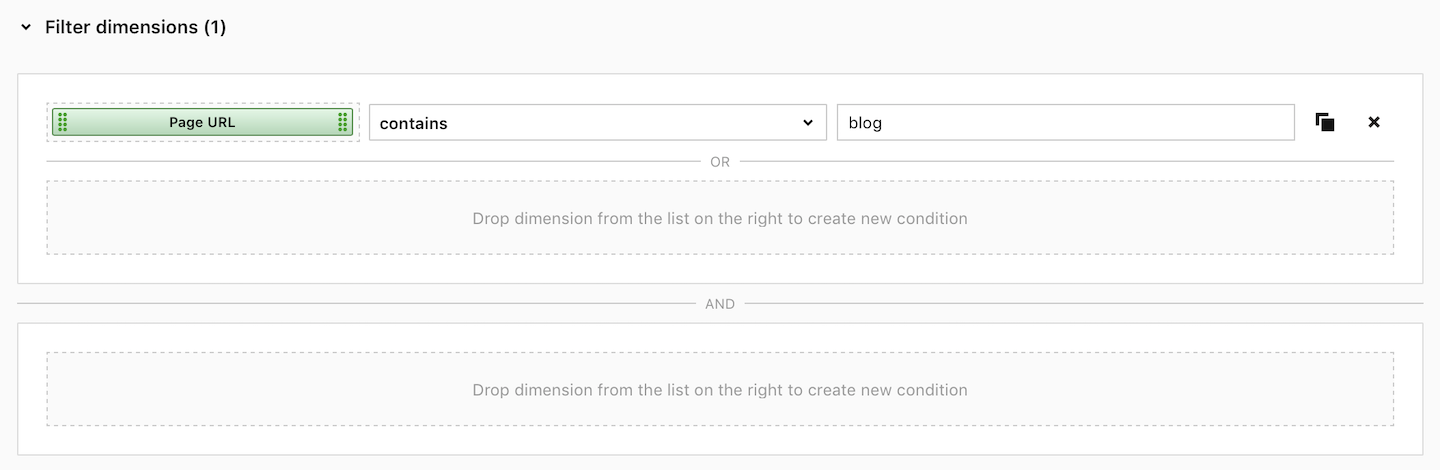
- (Optional) Apply filters to metrics or dimensions.
- Click Refresh preview to see a preview of the report. The preview will show sample data.
- When you’re happy with the report, click Save.
- (Optional) You can star your custom report to make it appear at the top of the list.
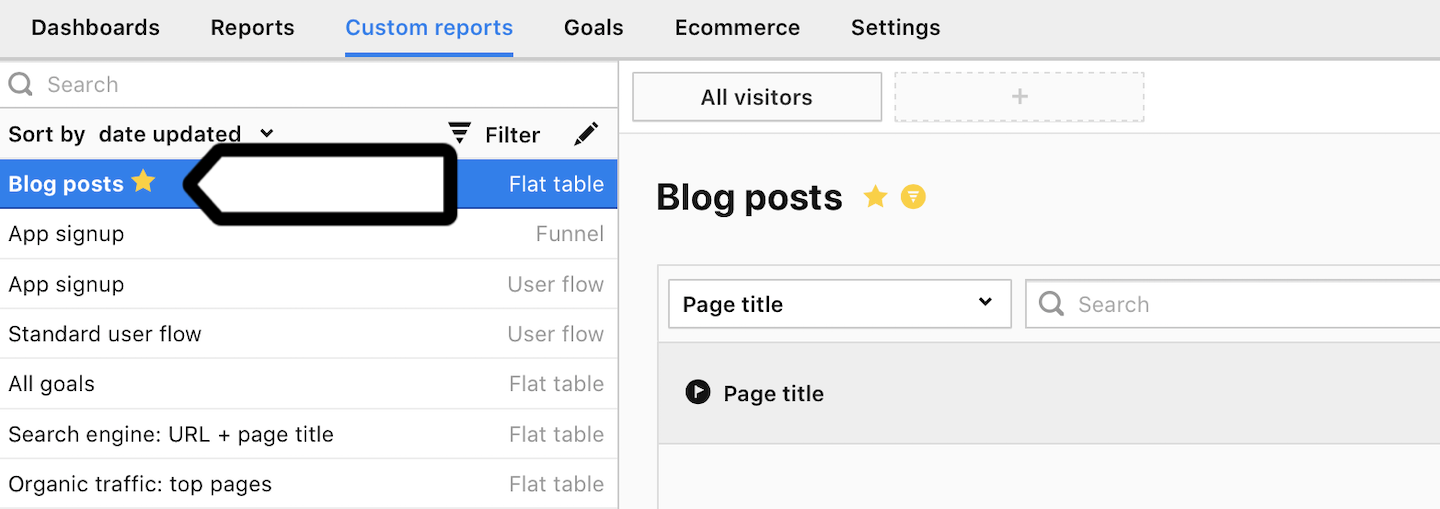
- Well done! Your custom report is now ready.
Tip: See 12 useful examples to better understand custom reports.