At this point, you probably have everything set up. Your website is added to Piwik PRO. The tracking code has already started collecting data. With the tracking plan at hand, you know what you want to measure. And you’ve got your segments ready. Finally, you can dive into the ocean of data. Yeah!
We’ll start with audience reports. These reports group data about people who visit your website and present it in several reports such as audience overview, session log, devices & software, location, engagement and more. By looking at these reports you’ll learn lots about people coming to your site, from the web browser they use to the time when they visit your website most often. It’s all there.
To access the audience reports, follow these steps:
- Go to Menu > Analytics.
- Navigate to Reports.
- On the left, click the report you want to work with.
First, we’ll look at a basic report called the audience overview.
Audience overview report
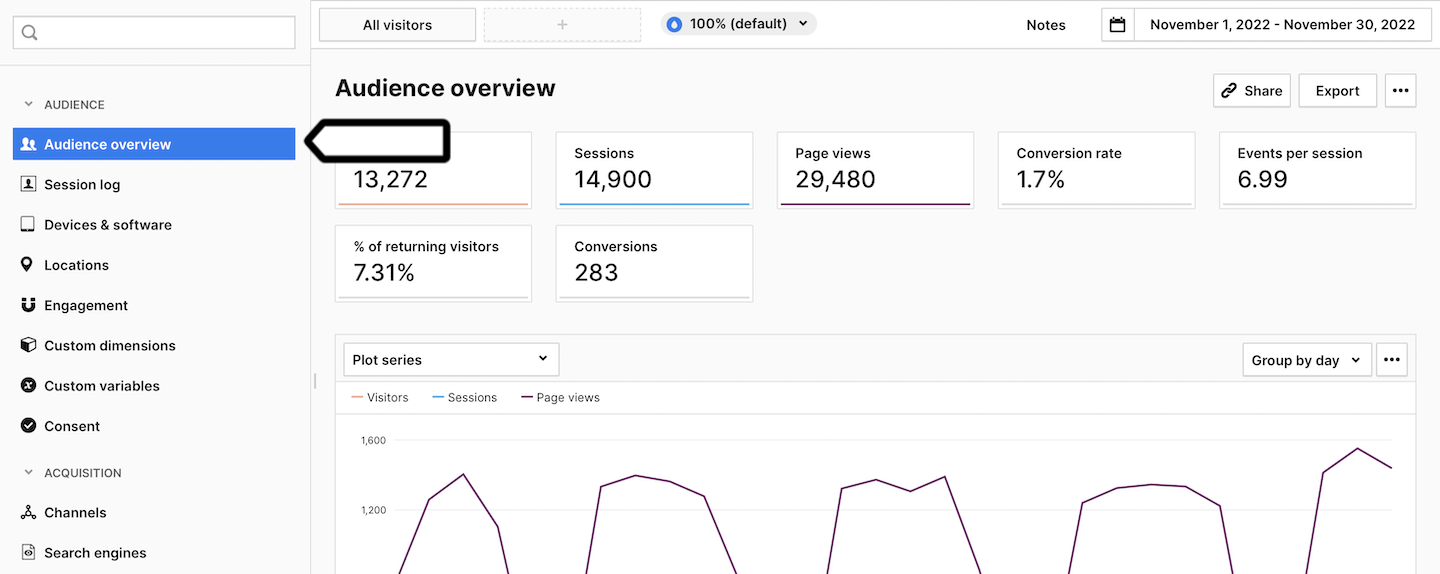
The audience overview report presents general yet important information about visitors. In this report you’ll see:
- Sessions: The number of sessions performed by visitors. A session starts with the first event and ends 30 minutes after the last event performed in that session. Read more
- Visitors: The number of unique visitors. Every visitor is counted once, even if they visit the website many times during the day. Read more
- Page views: The number of times a page was visited.
- Events per session: The average number of events in a session.
Events per session = Events / Sessions. - % of returning visitors: The percentage of people who came back to your website again.
- Conversions: The number of goal completions. (You need to set goals to collect this data.)
- Conversion rate: The percentage of sessions during which visitors completed a goal.
Goal conversion rate = Sessions with a completed goal / Sessions * 100%(You need to set goals to collect this data.)
By looking at these metrics, you will know how many people are interested in your website, how long they stay and how engaged they are. In other words, you will quickly see if your website is doing all right, or not.
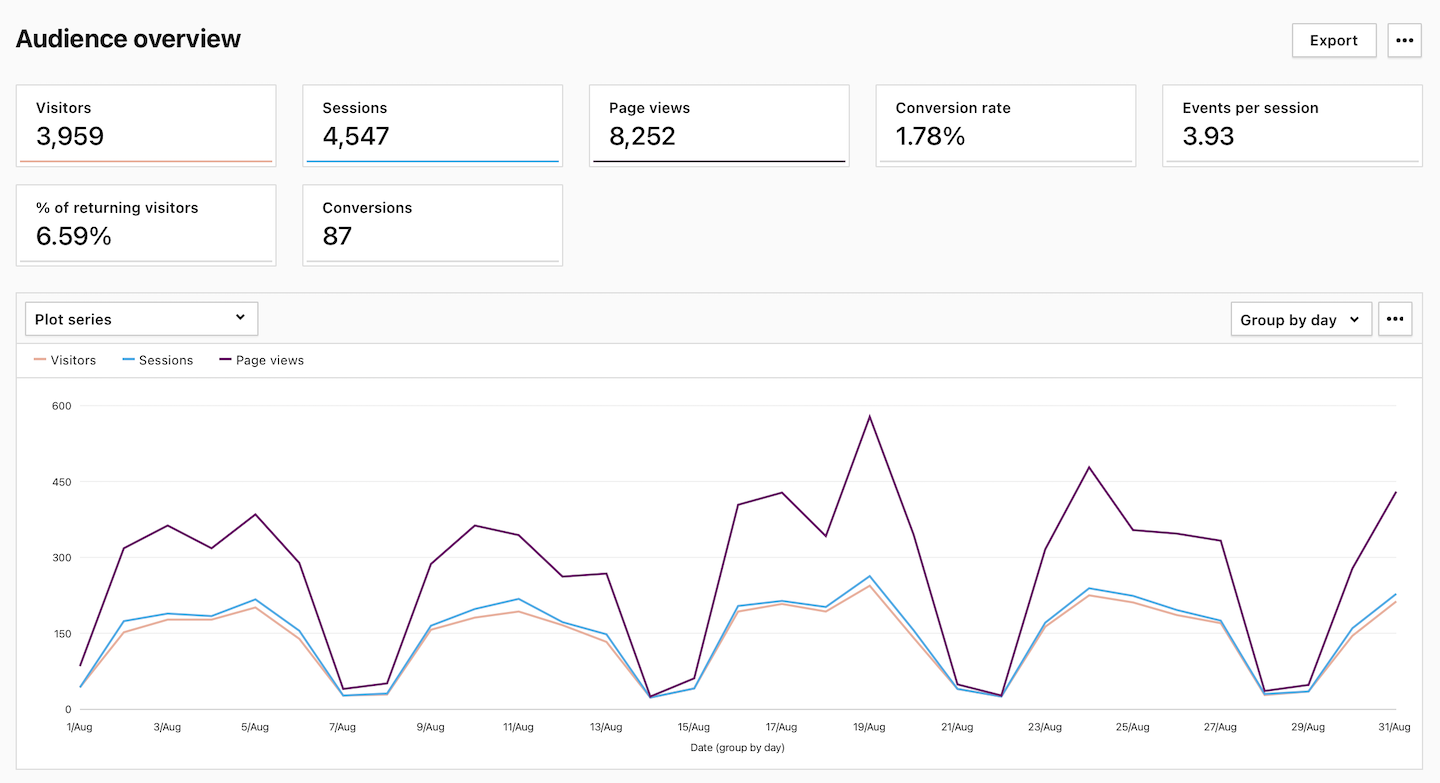
Report setup
Whenever you analyze any report, including the audience overview report, you can set up a few things: choose a website, select a date range, pick a segment and plot several metrics on the line chart.
To manage your report, follow these steps:
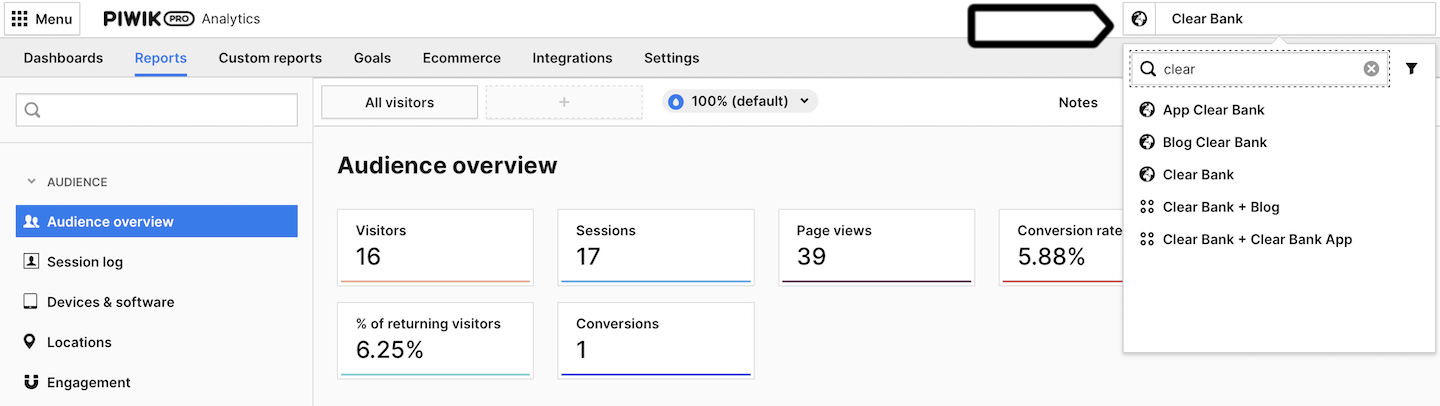
- Use the picker in the upper right corner to select your site.
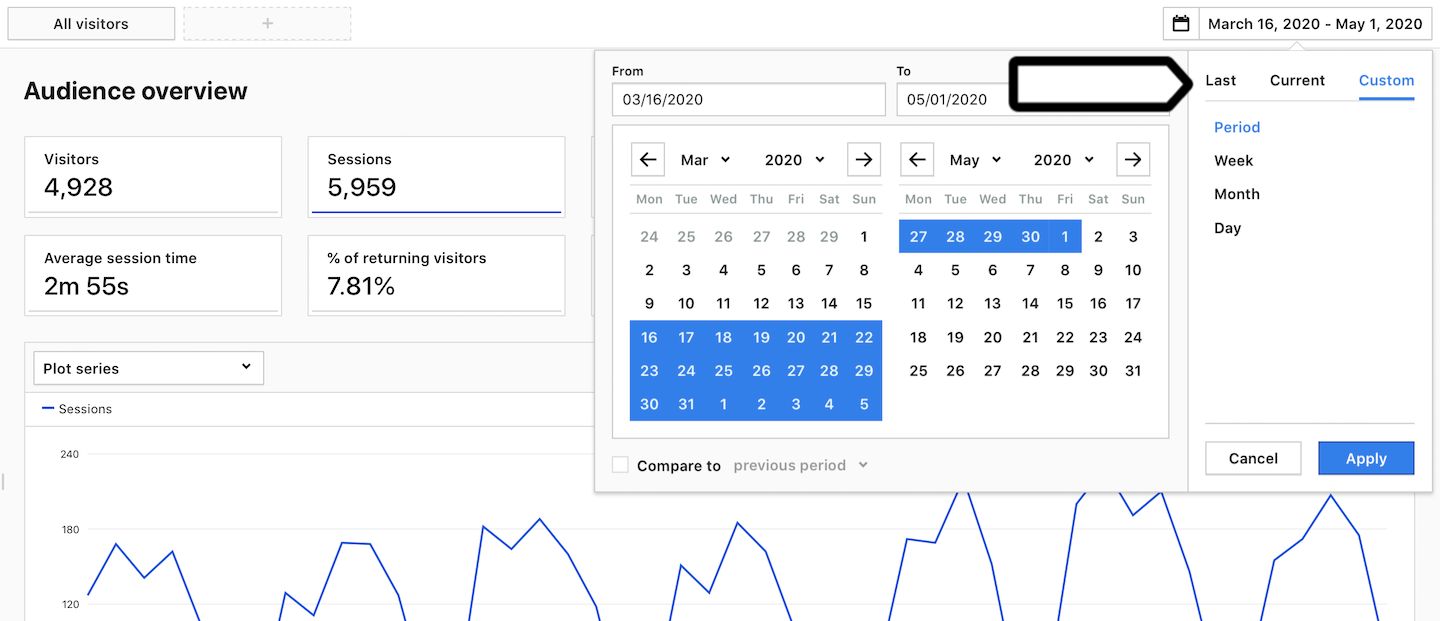
- Click the date picker in the upper right corner. Then select a time period and choose a date from the calendar.
- Click on the
All visitorstab. Then select the segment you want to analyze.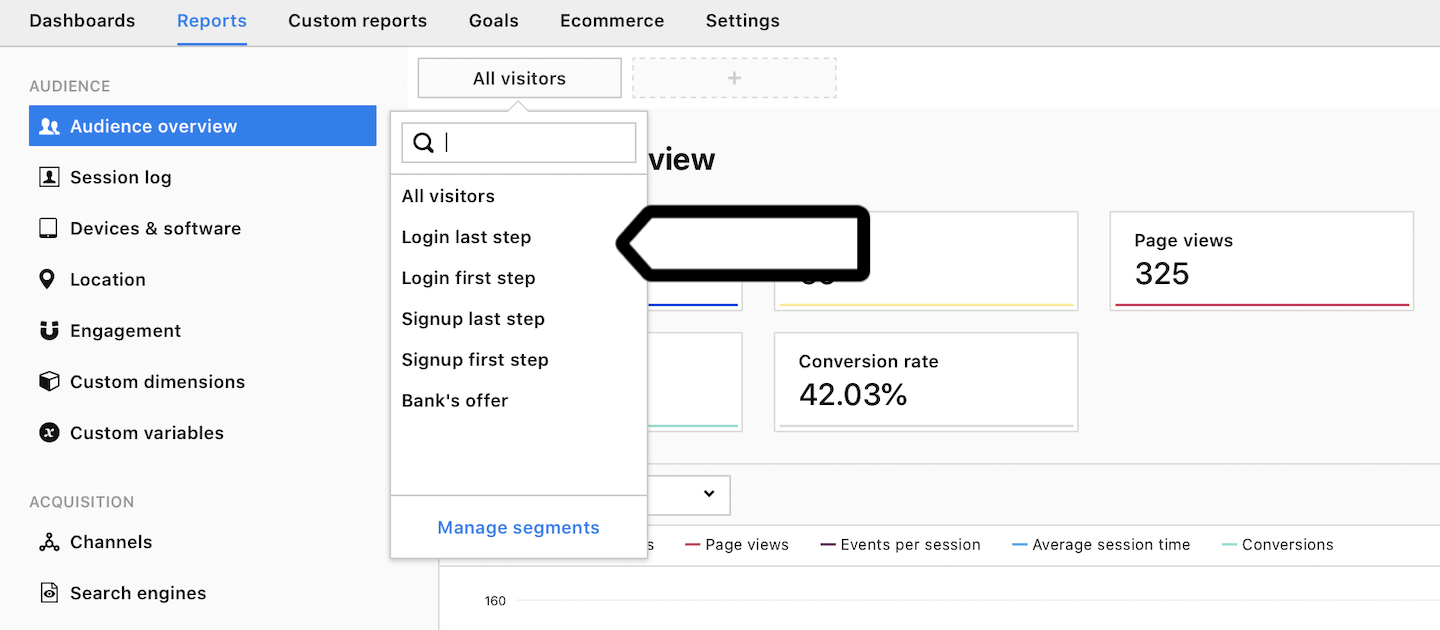
- Click on the
Plot seriesdrop-down menu and pick the metrics you want to plot. You can also click a box with the metric you want to plot.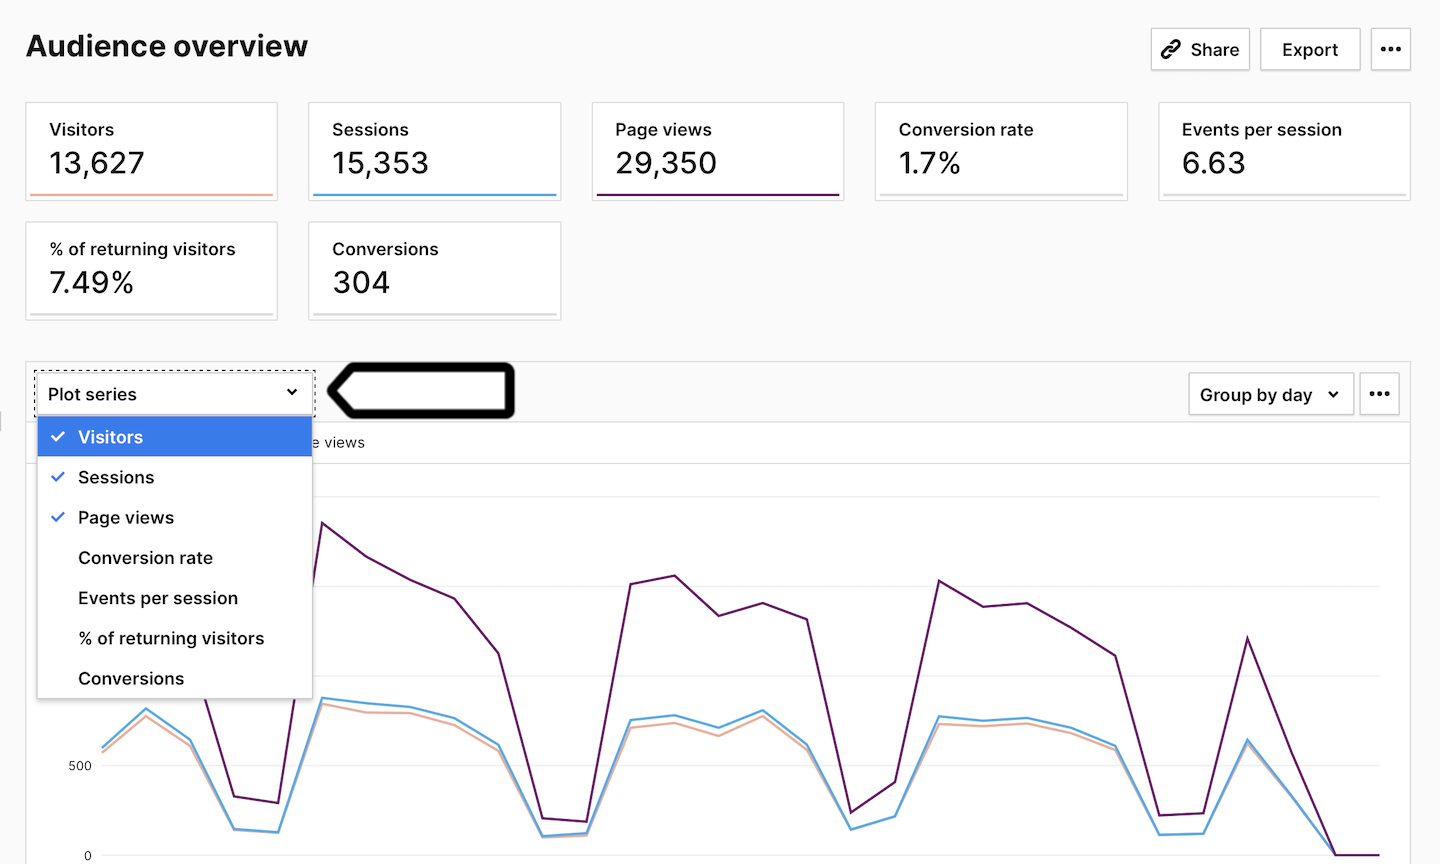
Now that you know how to manage your reports, we can move on to other reports in the audience section.
Engagement report
The engagement report is a blend of metrics showing you how much your visitors are attracted to your website. Do they just walk in and out, or are they hooked on to your site? The engagement report will answer these questions.
The basic metric to measure engagement is the number of returning visits. If you have lots of people coming back to your site, it means they like it and find it helpful. However, if you have a website that serves its purpose in just one session, this metric won’t be useful for you.
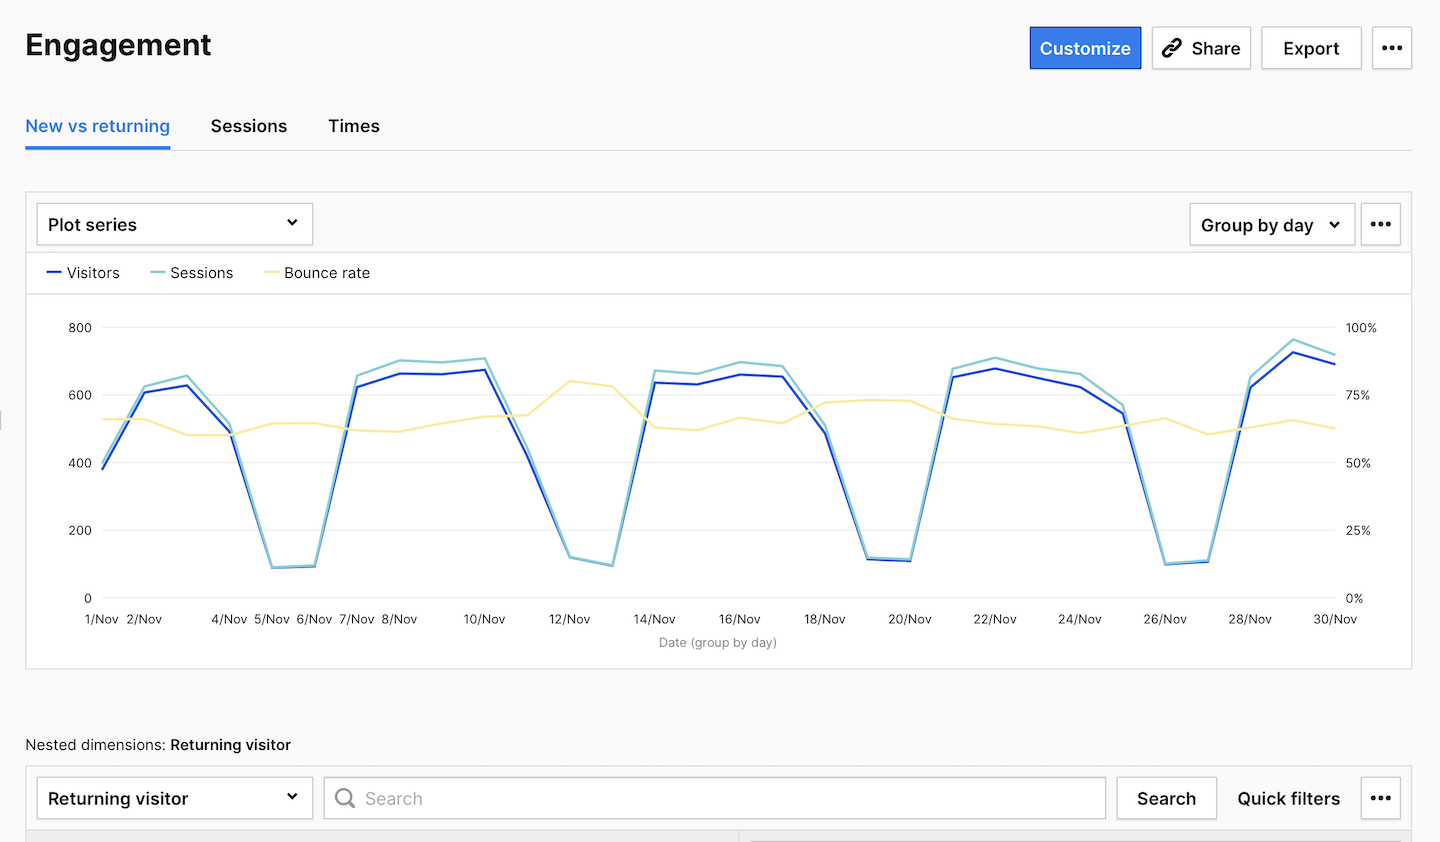
In the engagement report, you’ll see three subreports:
- New vs returning: This report compares new and returning visitors.
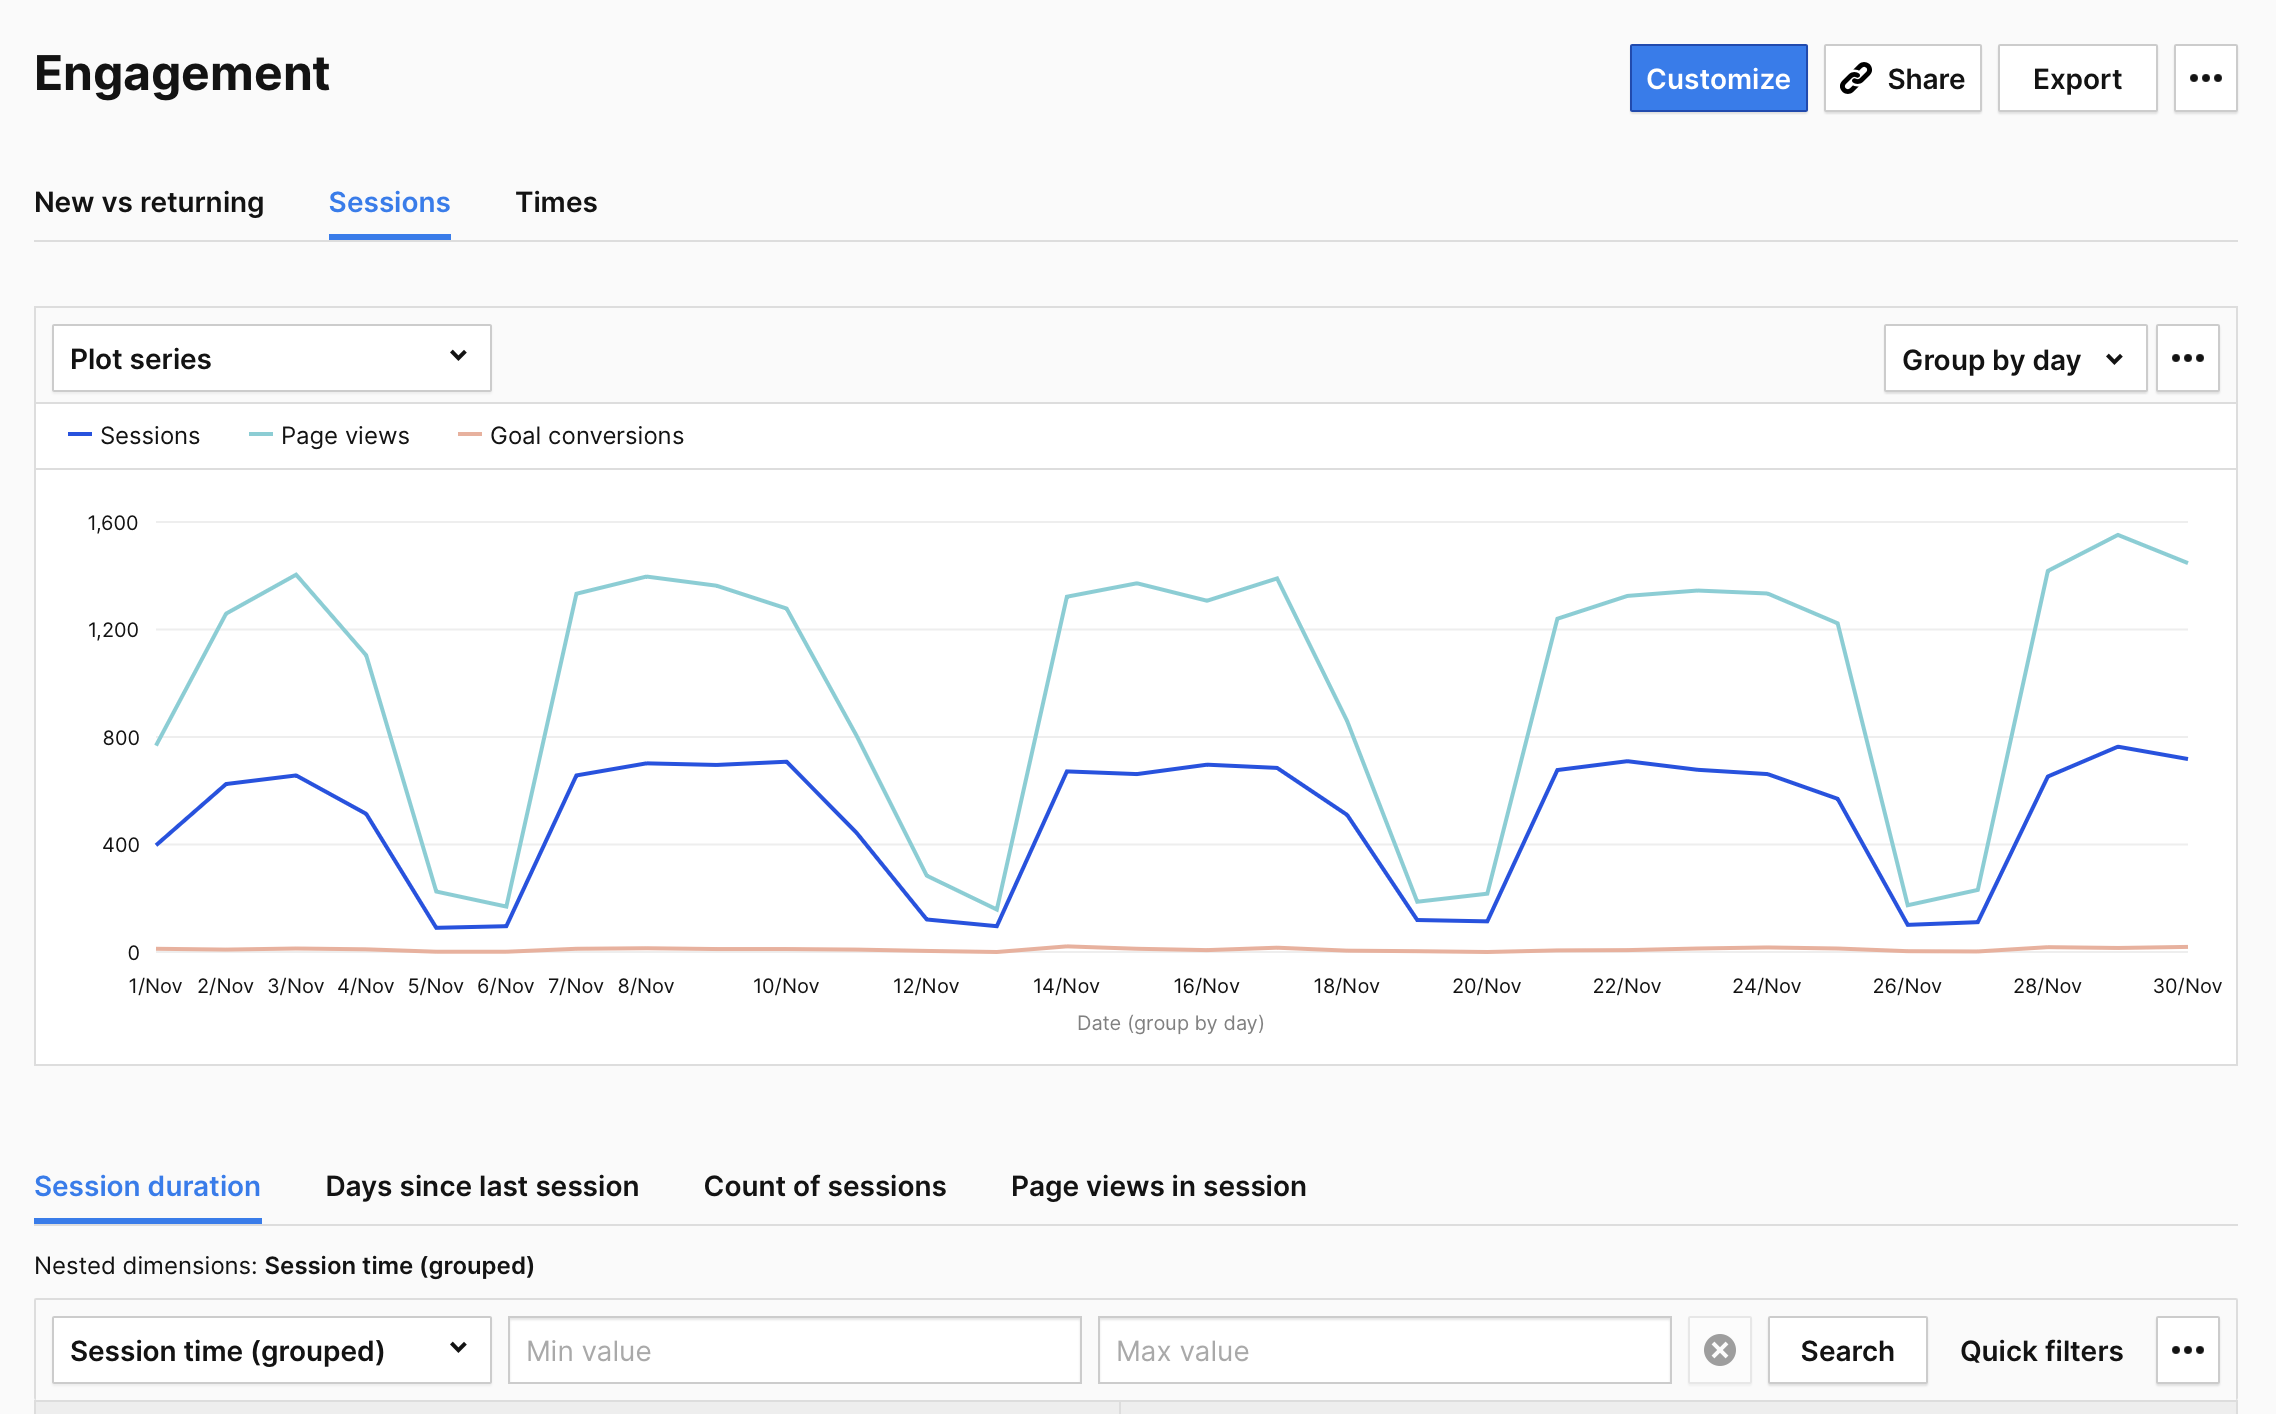
- Sessions: This report lets you dig deeper into stats about sessions.
- Times: This report shows you busy time on your website.
In the session subreport, you can check things such as:
- How long do people stay on your site? (Look at
Session duration.) - How quickly do people come back to your site? (Look at
Days since last session.) - How many sessions do people have on your site usually? (Look at
Count of sessions.) - How many pages do people view during a session? (Look at
Page views in session.)
From the time subreport, you can learn:
- At what time is your site crowded?
Because it’s not easy to define the time for your website, the report presents data for two time zones:
- Sessions per local time: The time of the visitor browser’s time zone.
- Sessions per server time: The time of your data center server’s time zone.
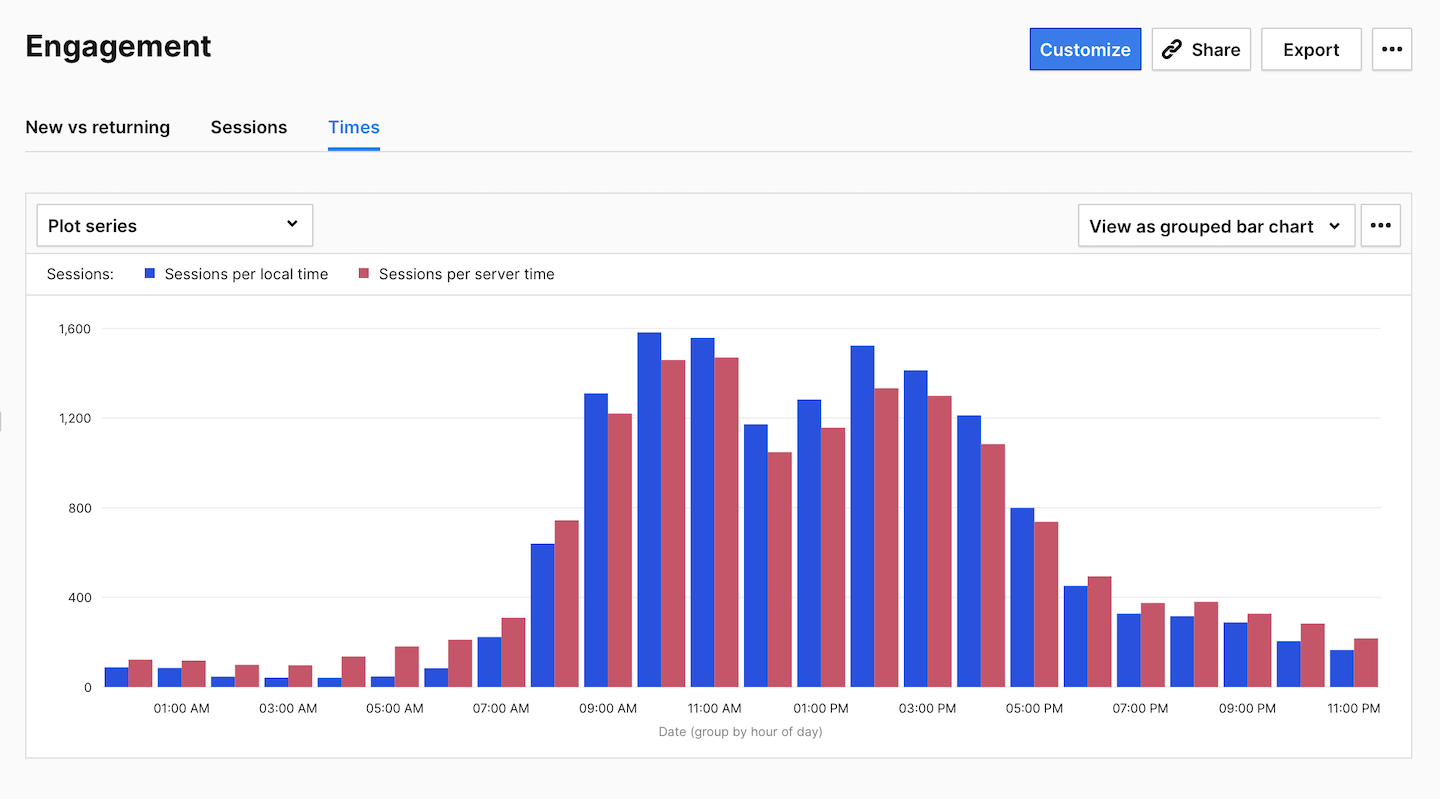
The time subreport will be useful for planning a pop-up campaign or for picking the best time for an email campaign. If your users are interacting with your website in the morning, it could be a perfect time to show up in their mailbox.
Other reports
There’s a dozen of other reports and subreports in the audience section. Yet we’ve described the ones that will inform you best about the general performance of your website.
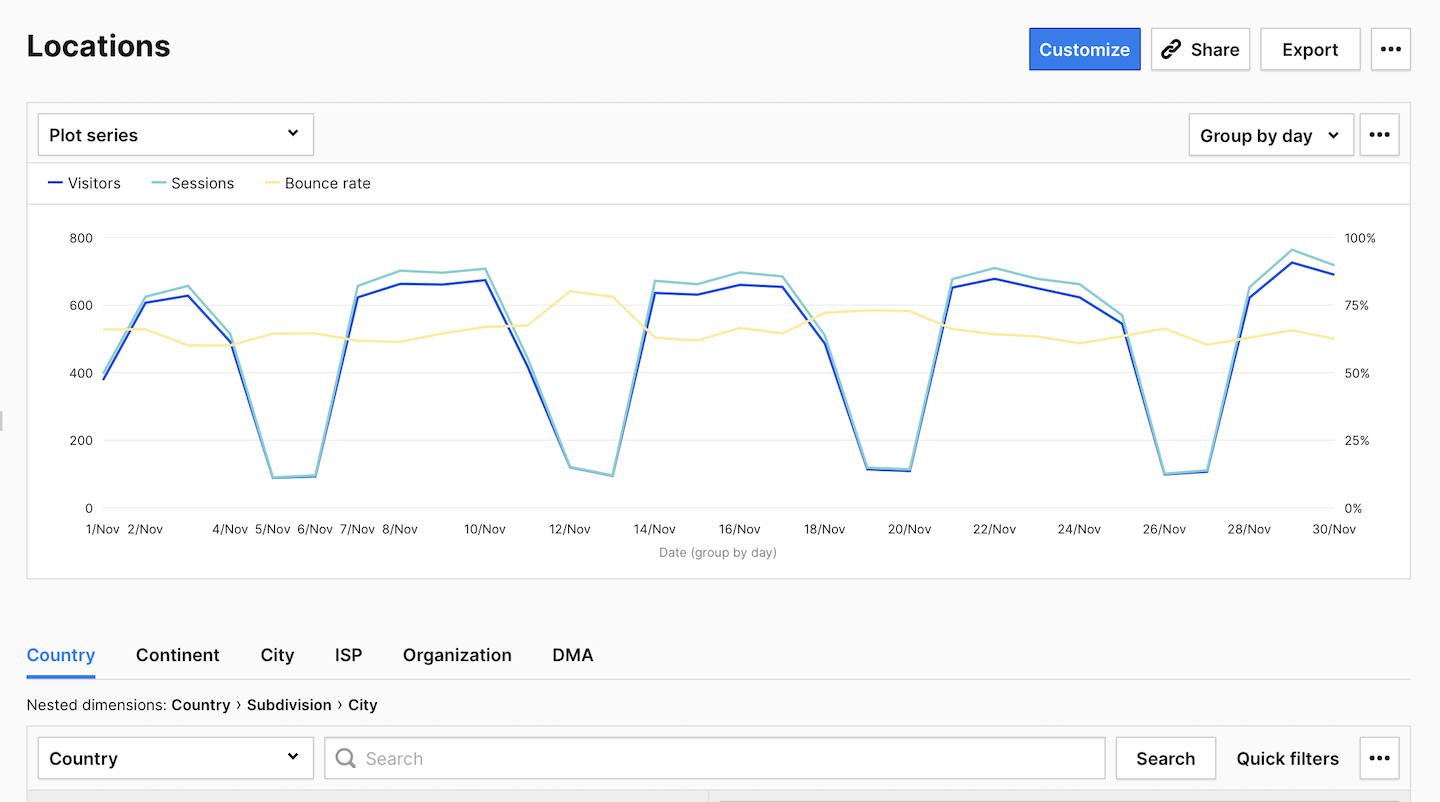
If you’d like to learn more about your visitors, feel free to use the location report. This report will tell you where your users are and what language they speak. If the region of your visitors is important for your business, this report can be a mine of knowledge. It can help you uncover new markets, target campaigns, or focus on the top regions.
If you want to know what are the most commonly occuring devices and operating systems, explore the device & software report. This report will give you information about the device type, model, brand and screen resolution that your visitors use. It will also tell you what operating system and browser are in use on visitors’ devices.
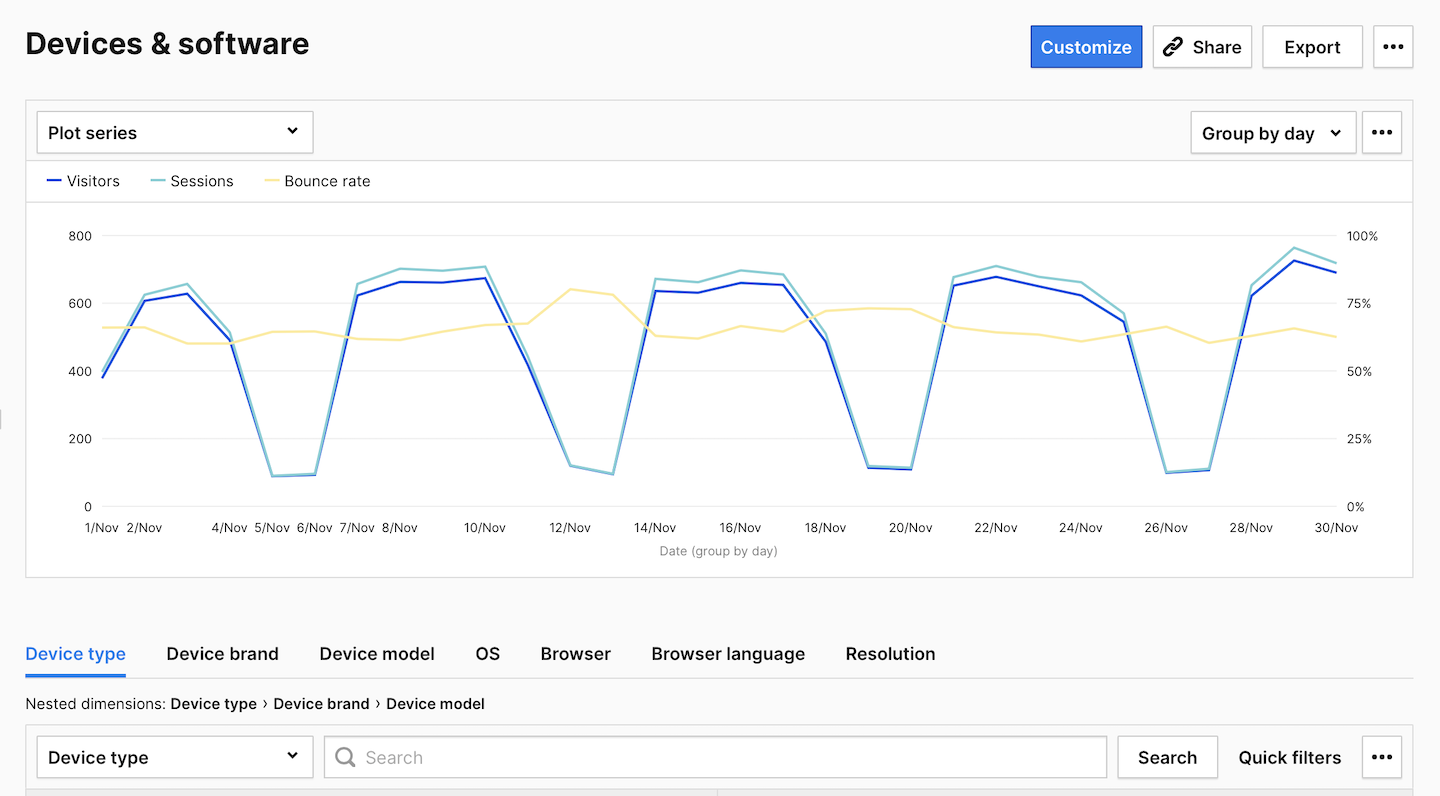
These reports will help you fine-tune your site for different devices and browsers. And they will be the most important reports to share with your web developers and designers.