The channel report shows traffic channels that visitors use to reach your site. With this report, you get the insights on where your traffic is coming from, helping you fine-tune your marketing strategy and make your site shine like a star.
Channel types
Here’s a list of five channel types used in Piwik PRO:
- Campaign: Visitors land on your site after clicking a link with added parameters:
utm_*,pk_*,gclidor custom campaign parameters. Campaign traffic is a result of marketing campaigns like ads placed on other websites, email marketing, social media posts, search engine marketing (SEM). The success of the campaign can be measured by the number of visitors it drives to your site and the engagement and conversion rates of those visitors. See more about tagging campaigns.Channel definition: source =
value from the campaign source (pk_source,utm_sourceor a custom parameter), medium =value from the campaign medium (pk_medium,utm_mediumor a custom parameter). - Direct entry: Visitors enter your site by directly typing its URL into their browser. This shows that they already know your site’s address, so the number of direct entries can be used as a measure of your brand awareness. When someone comes to your site through a direct entry, it’s a good sign that you’ve successfully made an impression on them and that they’re interested in what you have to offer.
Channel definition: source = direct, medium = direct
- Search engine: Visitors come to your site after clicking a link in search engine like Google or Bing. Search engine traffic is a good way to gauge how visible your business is in search engines. Google is the most popular search engine, with a market share of over 90%. But there are many other search engines out there, like Bing, Yahoo, DuckDuckGo. We detect about 275 different search engines.
Default values for channel definition: source =
detected search engine name, medium = organic - Social: Visitors enter your site from social media platforms like Twitter, Facebook, YouTube. Social media can drive lots of new traffic to your site. When people share links to your site on social platforms, it can increase visibility and attract new visitors. Social media platforms grow in numbers, and we currently recognize about 75 different ones.
Channel definition: source =
detected social network name, medium = referral - Website: Visitors come to your site after clicking a link on another site. For example, if you place a link to your site on medium.com and someone clicks on it, the traffic from that link will be recorded as website traffic from medium.com. Website traffic indicates that your content resonates with users on other sites. If you see that a particular site is sending a lot of referral traffic your way, focus on promoting your content there to increase your traffic even more.
Channel definition: source =
referrer domain name, medium = referral
Note: If default channels are not enough for you, you can use custom channel grouping.
View the channel report
To view the channel report, follow these steps:
- Go to Menu > Analytics.
- Navigate to Reports.
- On the left, click Channels.
- Voila! You can now view your report.
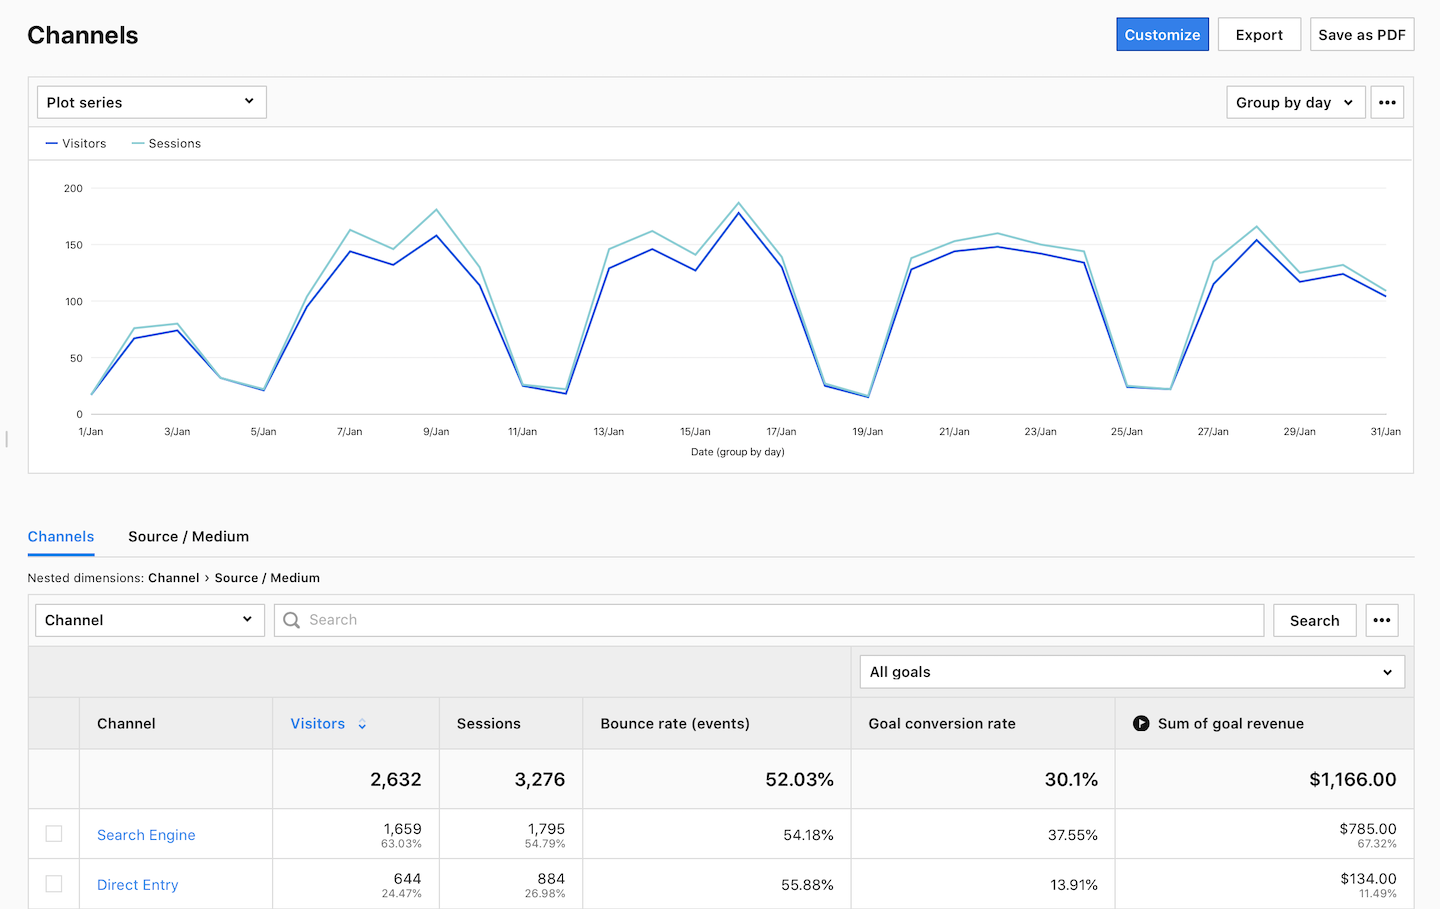
- (Optional) Click a section name to view a specific section of this report.
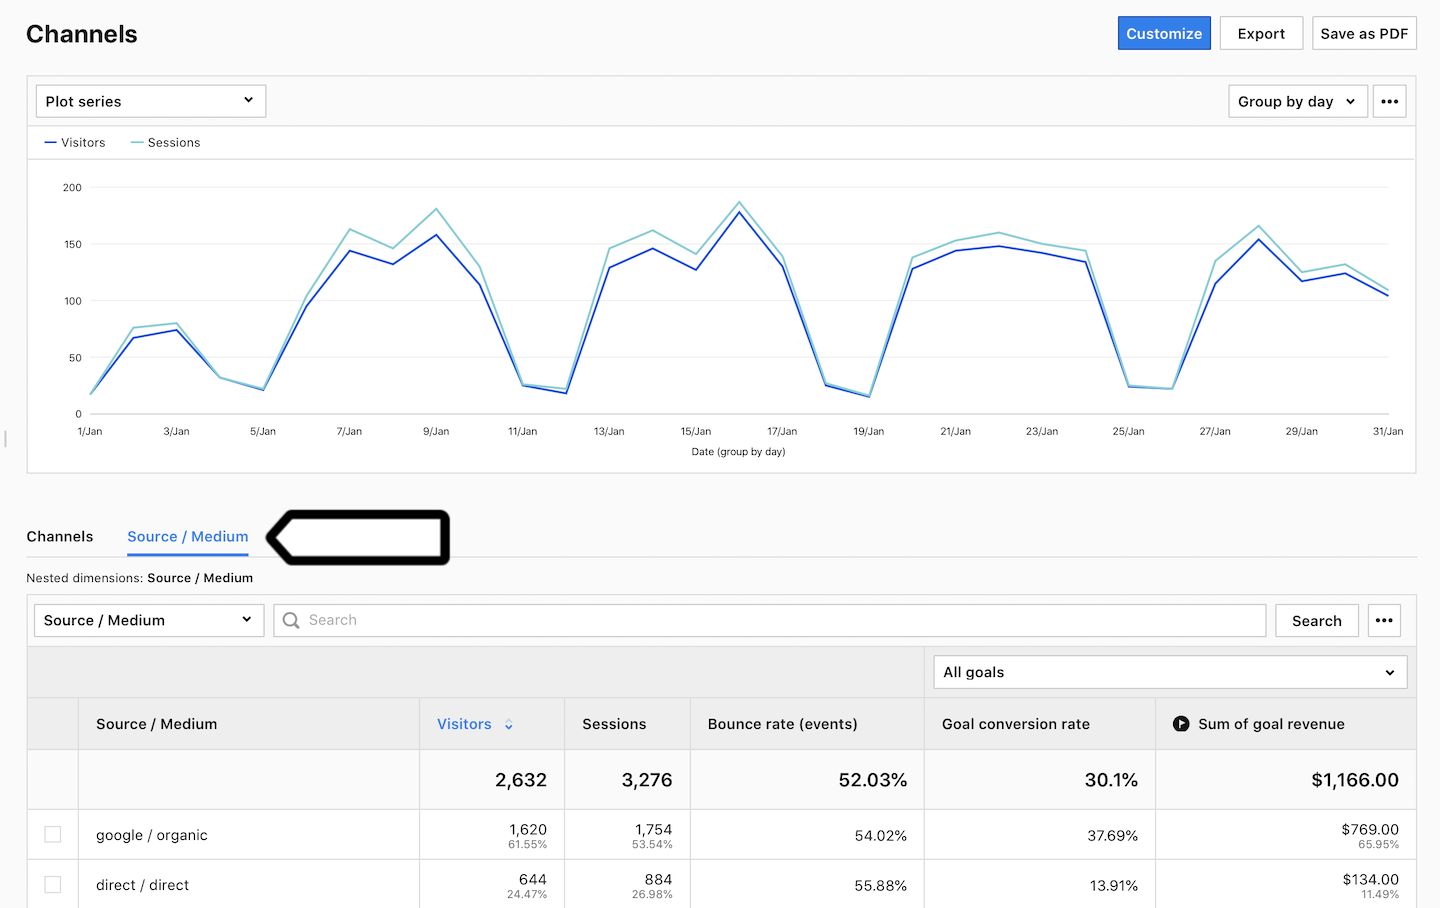
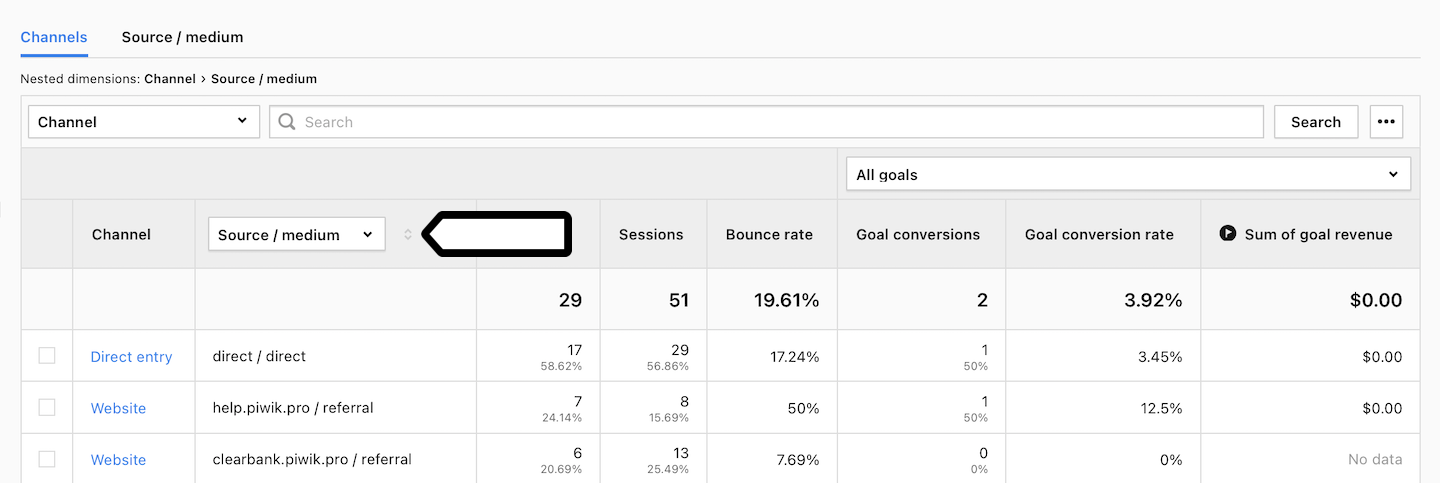
- (Optional) If you come across a nested dimension in the report, simply click on the dimension to explore more detailed data.
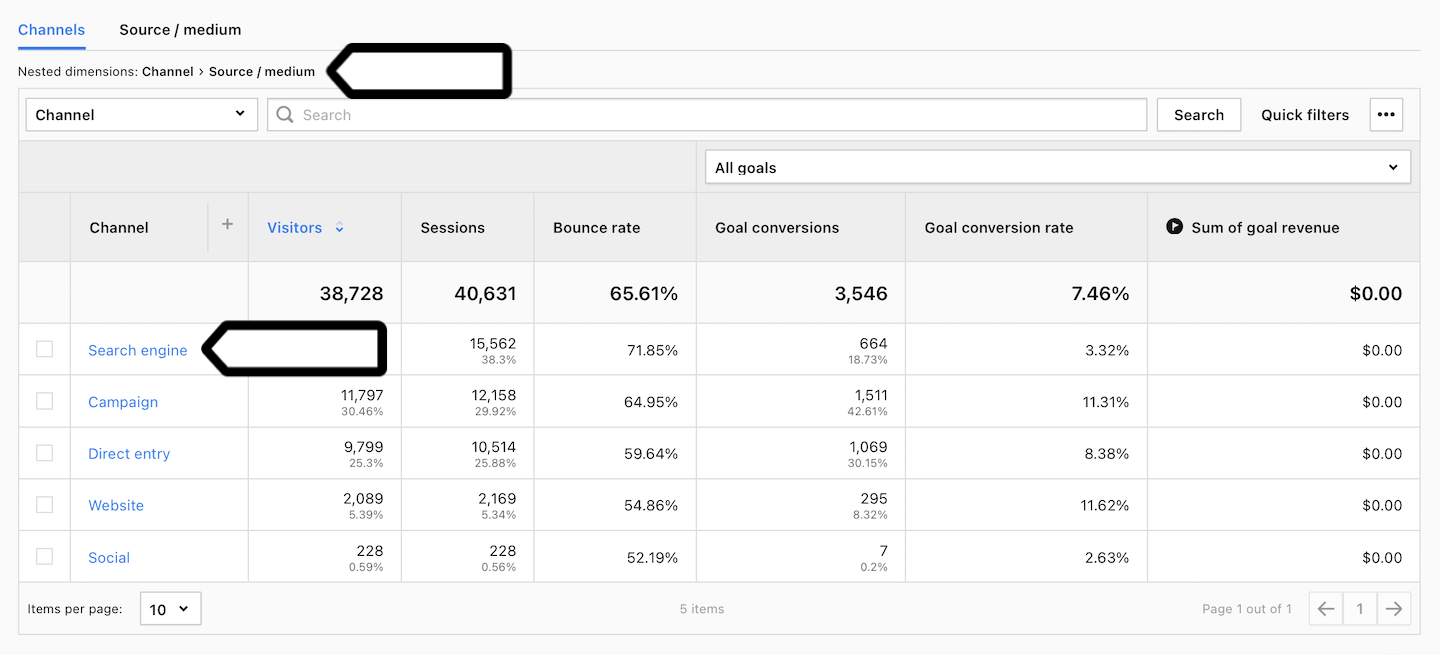
- (Optional) If you want to see two dimensions in a single view, click + and choose a dimension.
Metrics in the report
The table below describes the metrics you’ll find in your channel report.
| Metric name | Description |
|---|---|
| Visitors |
The number of unique visitors. Every visitor is counted once, even if they visit the website many times during the day. Note: Learn more about visitors. |
| Sessions |
The number of sessions performed by visitors. A session starts with the first event and ends 30 minutes after the last event performed in that session. Note: Learn more about sessions. |
| Bounce rate |
The percentage of sessions in which visitors only viewed one page and didn’t proceed to another page, goal conversion or order. Note: Learn more about bounce rate |
| Goal conversion rate |
The percentage of sessions in which visitors completed a goal. Note: You need to set goals to collect this data. |
| Sum of goal revenue |
The amount of revenue generated by a goal. Note: You need to set goals to collect this data. |
Note: If you add up visitors from different channels, the total may be more than the actual visitors and go over 100%. This happens when the same person visits your site through multiple channels — they get counted for each channel but only once for the total count.