The Piwik PRO site inspector is an extension for Chrome that shows heatmaps, real-time sessions and other analytics data right on every page of your site. In this article, we’ll show you how to add the extension, start collecting data for heatmaps, clickmaps and scrollmaps and use the site inspector.
Install the site inspector in Chrome
To add the extension, follow these steps:
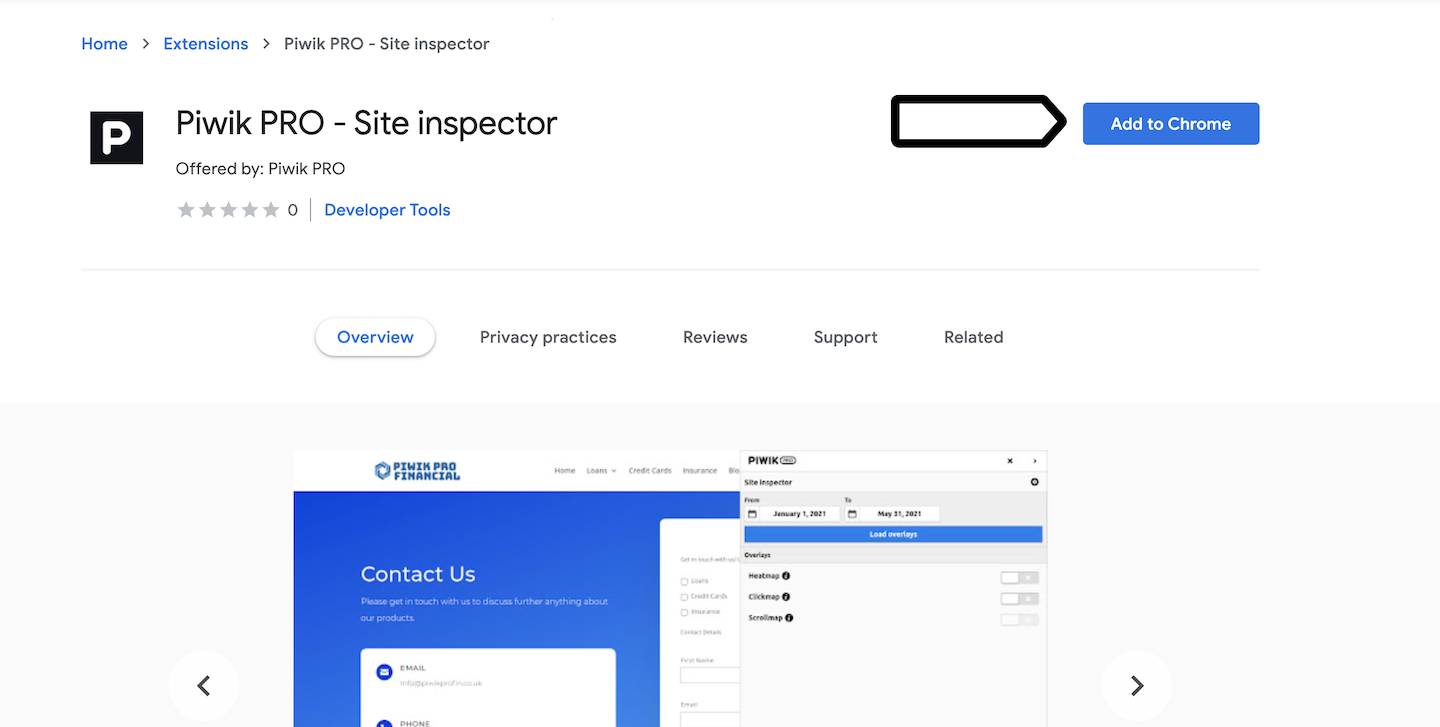
- Open our extension in your Chrome browser.
- Click Add to Chrome.
- Confirm your installation.
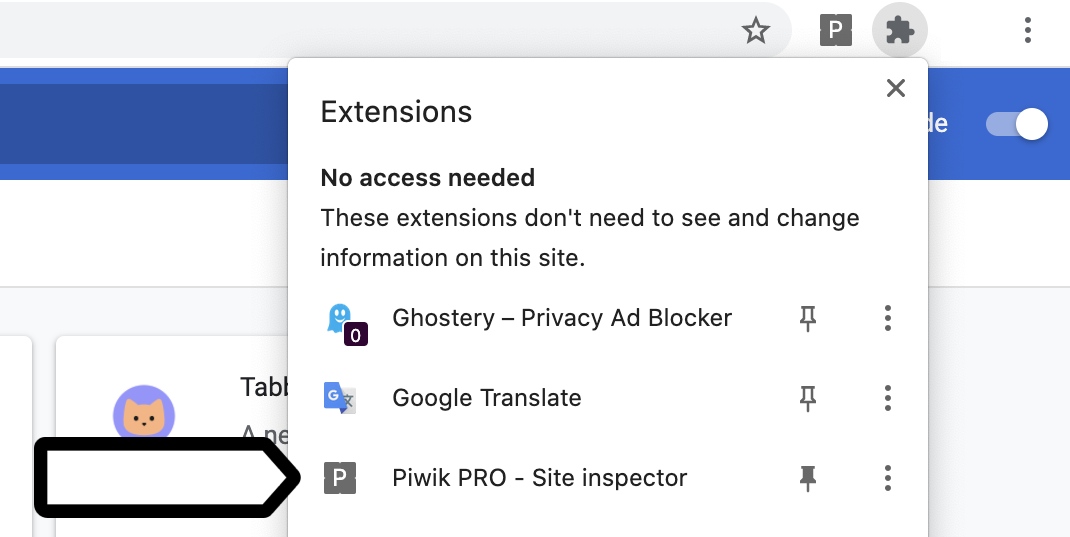
- Pin the extension. You’ll be able to quickly access it in the browser.
- Go to the site or app that you want to analyze with the site inspector.
- Click on the extension icon in the browser’s menu and click on Piwik PRO – Site inspector. You’ll see an authorization panel on the right.
- Click Authorize extension.
Note: To authorize the extension, you need to have access to Analytics and the following site or app permission: owner, manage, edit & publish, edit or view.
- Done! You can start using the tracker debugger in the site inspector right away (
available from 16.3.0). For a heatmap, clickmap and scrollmap, you need to start collecting data.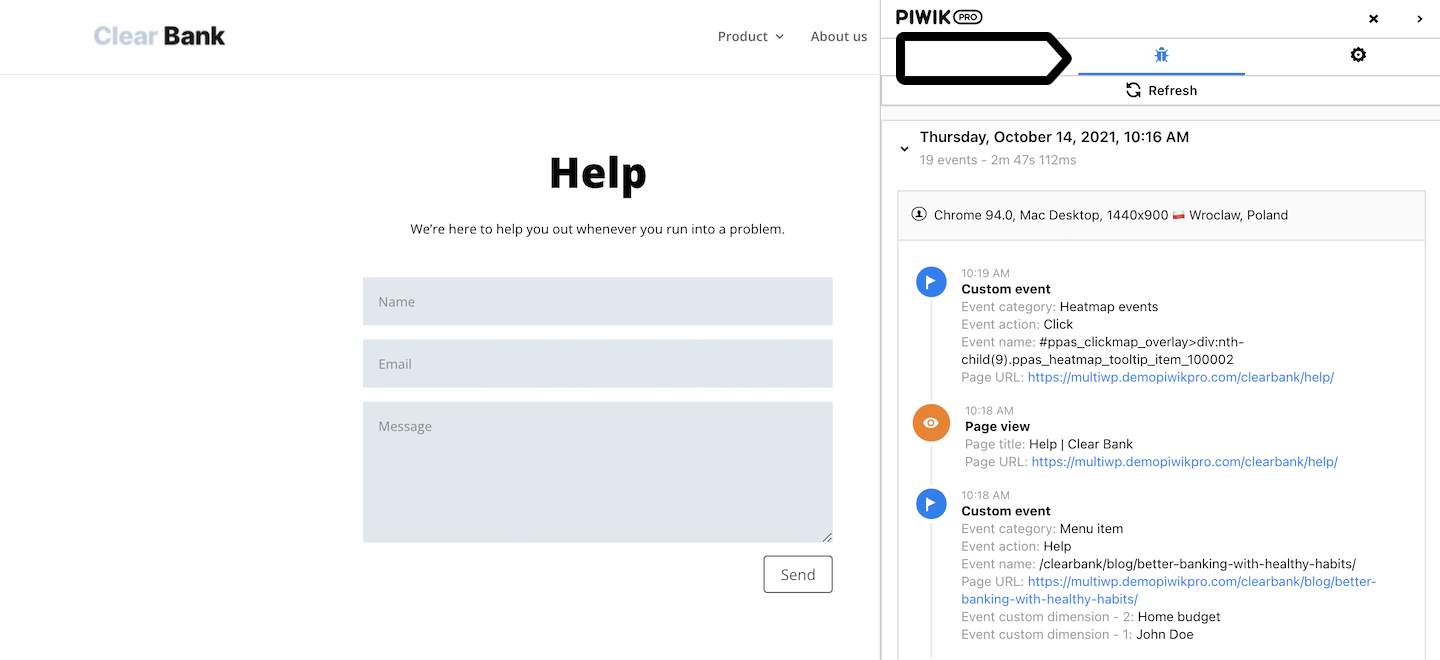
Note: To see data in the site inspector, you need to have access to Analytics and the following site or app permission: owner, manage, edit & publish, edit or view.
Collect data for a heatmap and clickmap
Note: For versions below 16.8.0, use a custom code to collect data for heatmaps and clickmaps.
To collect data for heatmaps and clickmaps, use our heatmap & clickmap tag. This tag captures page clicks as custom events and sends them to Analytics. The site inspector can then access this data to display heatmaps and clickmaps on your pages.
To add our heatmap & clickmap tag, follow these steps:
- Go to Menu > Tag Manager.
- Navigate to Tags.
- Click Add a tag.
- Name the tag and select the following type: Heatmaps & clickmaps.
- Click Next.
- In Advanced tag settings, choose Consent type. Set it up if you use a consent form on your site. This tag will only fire for visitors who accept the selected consent type.
- Respect opt-out and DNT is turned on by default. Leave it as is if you want to respect visitors who’ve turned on the Do-Not-Track feature in their browsers or who’ve opted out of tracking using our opt-out form.
- In Flight dates, set the date and time when the tag will fire.
- In Tag triggers, click Add a trigger or Choose existing trigger to set up a trigger for this tag.
- Use a click trigger without conditions to track all clicks on any page.
- Use a click trigger with conditions to track specific clicks.
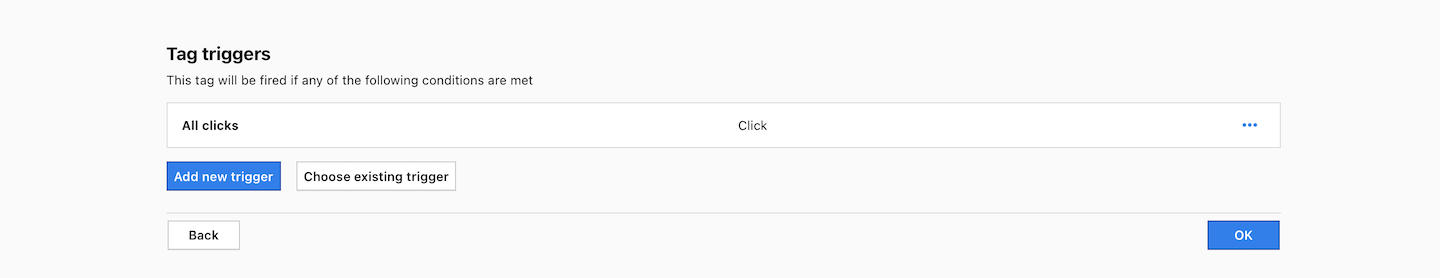
Note: Only a click trigger can be used for a heatmap & clickmap tag.
- Click Save.
- Test your tag in debug mode.
- If everything works fine, click Publish.
- All set! Data is now being collected. Give it an hour or so and you’ll find it in our site inspector on Chrome.
Collect data for a scrollmap
Avaliable from 16.22.0
Piwik PRO collects scroll data automatically. You don’t need to set anything up to see scroll data in the site inspector. Just make sure that nobody has turned off the option responsible for tracking page scrolls.
To check the page scroll tracking option, follow these steps:
- Go to Menu > Administration.
- Navigate to Sites & apps.
- Pick the site you want to check.
- Navigate to Data collection.
- In Page scrolling, the following option should be turned on: Measure scroll depth.

Note: If you’re tracking page scrolls with your own custom events, we recommend removing them. Otherwise, scroll events will be tracked twice.
Note: You can also use manual scroll tracking, but we recommend staying with the automatic method.
How to use the site inspector in Chrome
Now, we’ll take you on a brief tour of our site inspector.
To use the site inspector, follow these steps:
- Open your site and navigate to the page you want to view.
- Click on the extension icon in the browser’s menu and click on Piwik PRO – Site inspector.
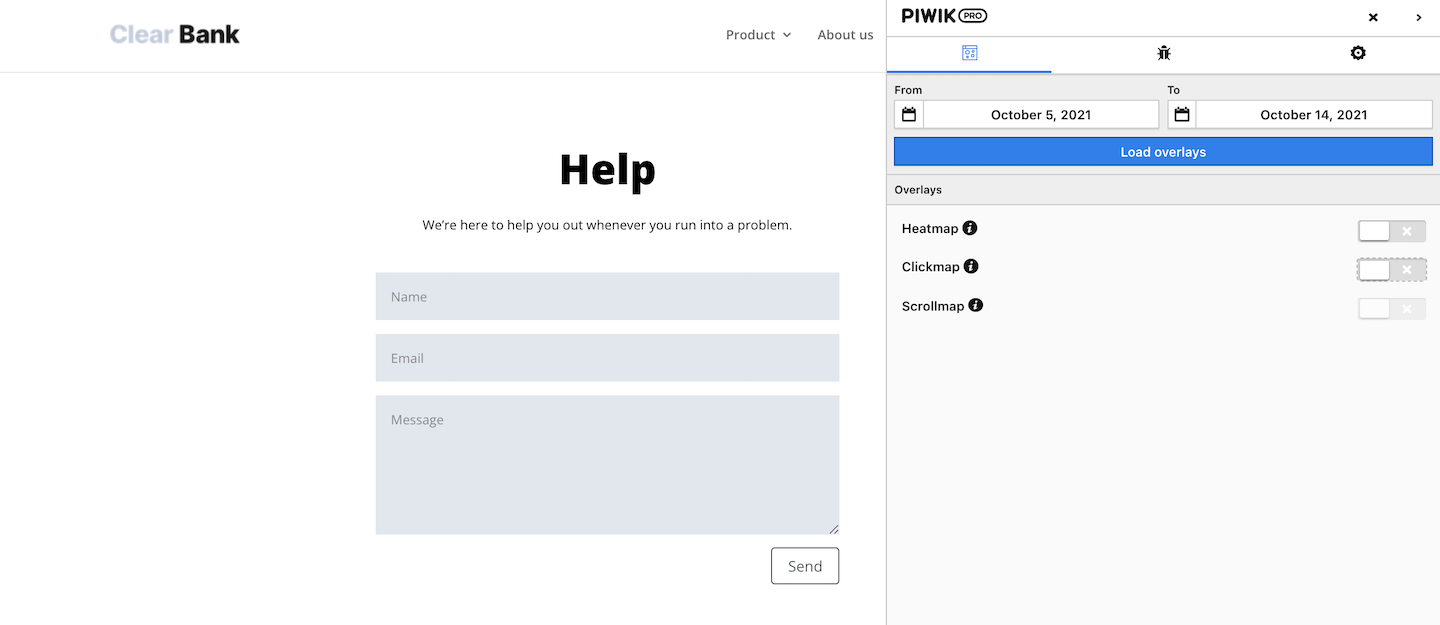
- The site inspector will appear on the right.
Note: To see data in the site inspector, you need to have access to Analytics and the following site or app permission: owner, manage, edit & publish, edit or view.
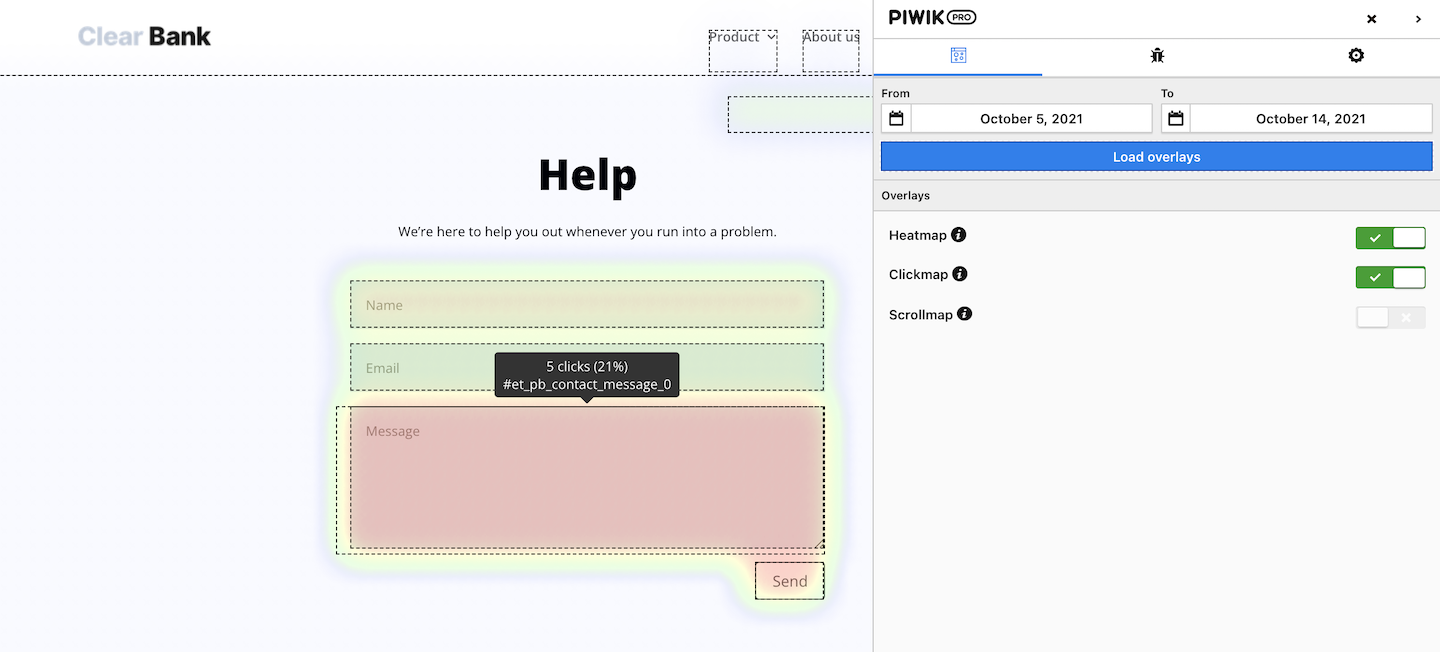
- Choose the date range and click Load overlays.
- Turn on Heatmap, Clickmap or Scrollmap.
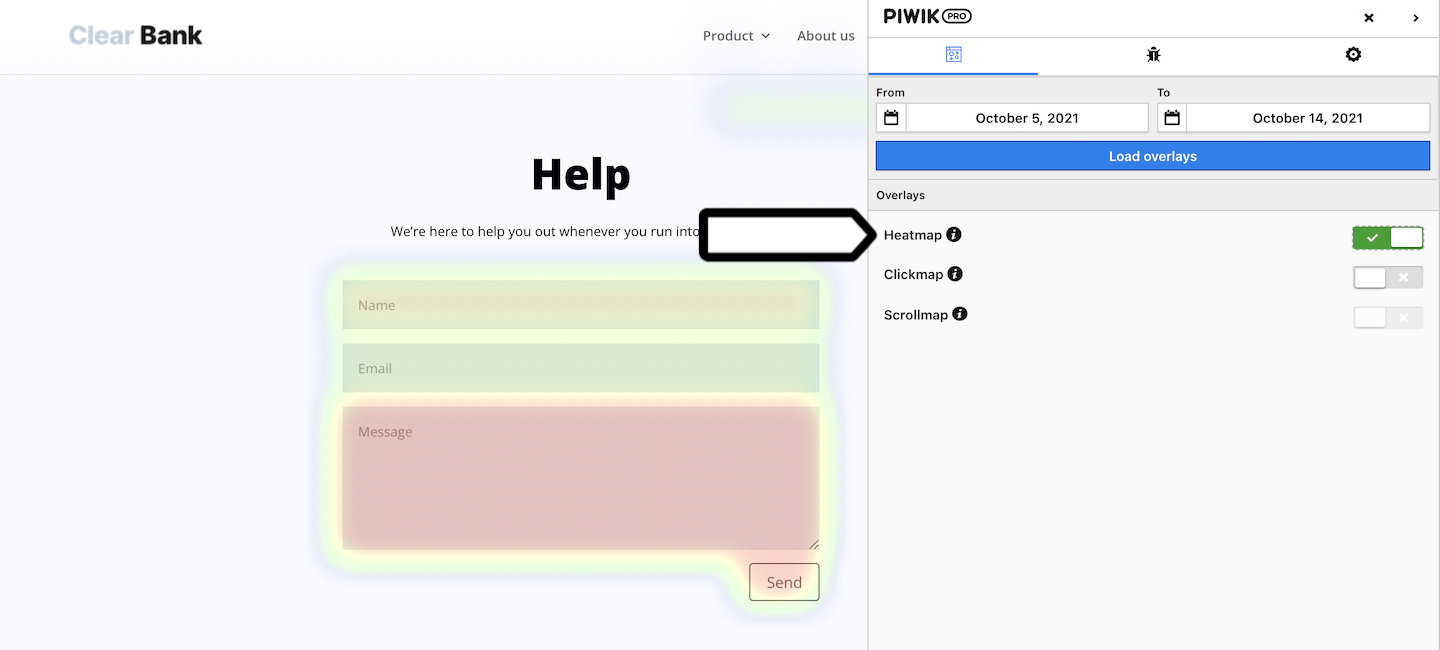
Here’s what each map shows:
- Heatmap: Shows where people clicked on the page. Warm colors mean lots of clicks, while cool colors mean fewer.
- Clickmap: Outlines the clicked elements. Hover over an element to see click details like count, percentage and element ID.
- Scrollmap: Displays how far visitors scrolled down the page.
Note: You can have all the maps up simultaneously. Whenever you switch dates or pages, click Load overlays to see the data. And remember to load overlays again if the layout of elements changes after you scroll or interact with the page.
Available from 16.3.0(Optional) Click on the bug icon to open the tracker debugger with your ongoing session.- (Optional) Click on the setting wheel to change settings.
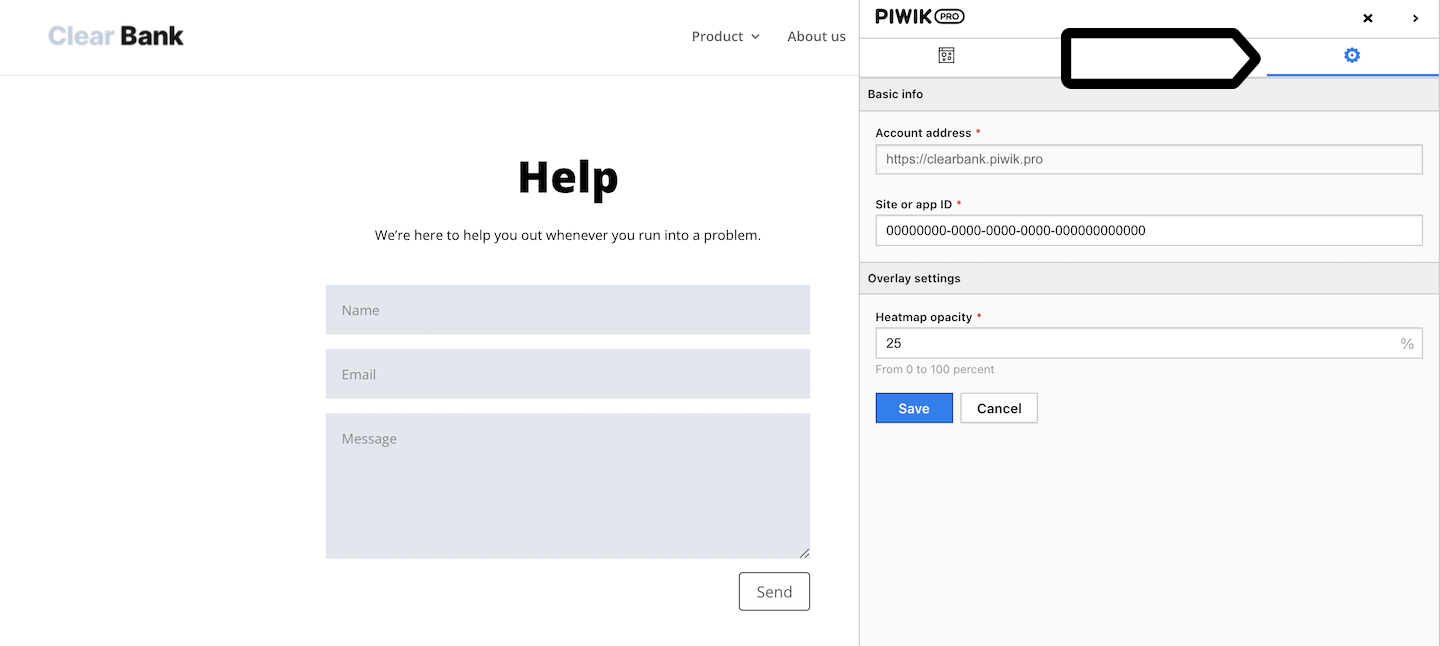
- All done!