SharePoint reports is an additional section in Analytics dedicated to the SharePoint integration. It is designed to help you understand user engagement, see popular content and authors, optimize the search engine and so on.
Before you can use SharePoint reports, you need to integrate with SharePoint with the help of our technical support. During the integration process, you’ll learn how to set up tracking and organize reports. But for the need of this article, we’ll just explain some basics.
SharePoint is organized around site collections, which are similar to sites. A site collection is a group of sites that have the same owner and share administrative settings. When you track SharePoint with Piwik PRO, you set up each site collection as a separate site (Sites & apps). If you’re collecting data from many site collections, it’s best to create and use meta sites/apps for reporting because they allow you to see all site collections in a single view.
Note: Site collection is called Website name in Piwik PRO because it is tracked as a site (Sites & apps).
To view SharePoint reports, follow these steps:
- Go to Menu > Analytics.
- Navigate to SharePoint.
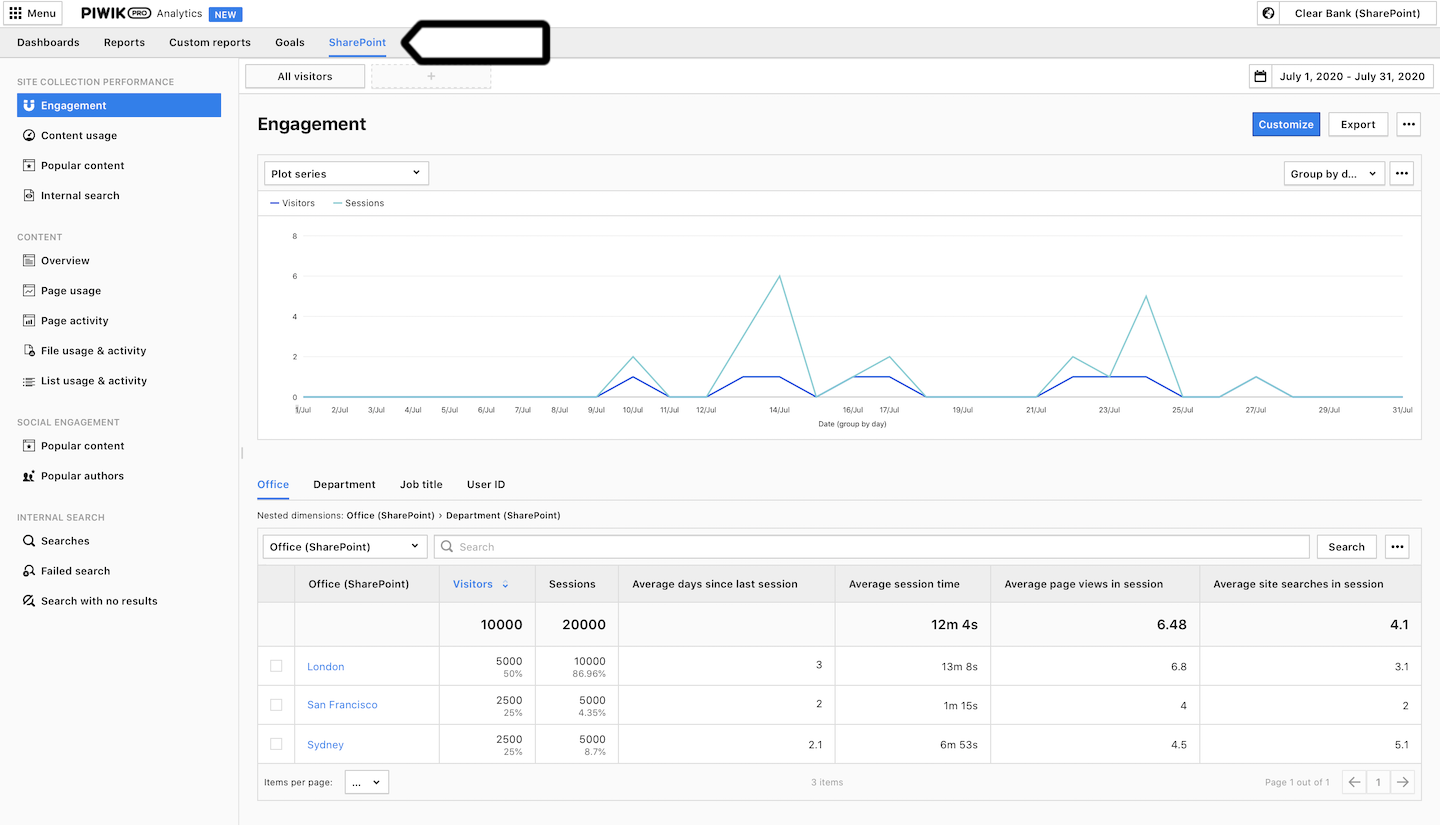
SharePoint reports are grouped into four categories: (1) site collection performance, (2) content, (3) social engagement and (4) internal search. They include over thirty metrics and dimensions dedicated to the SharePoint analytics, including likes, shares, comments, user data, author data, file types and more. Let’s take a look at each category.
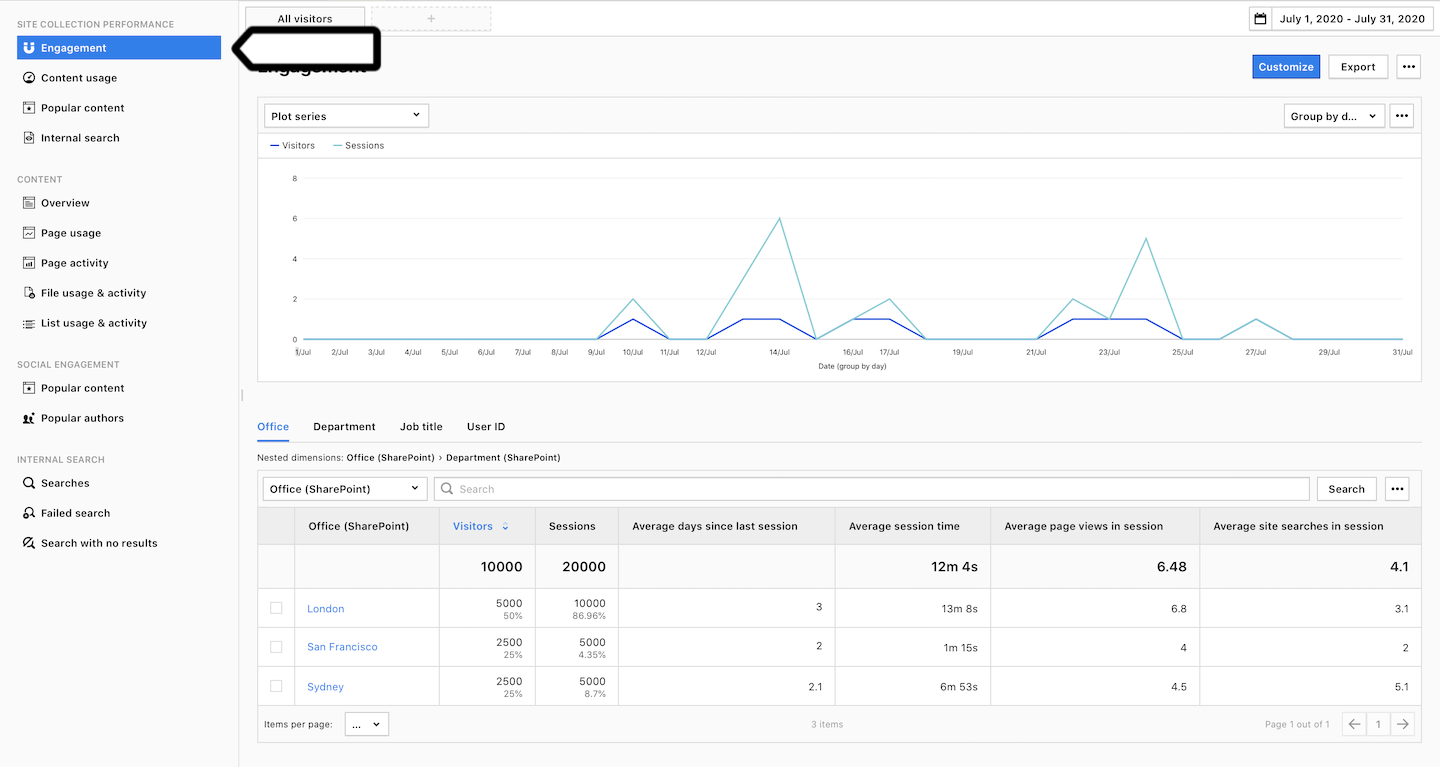
Site collection performance
Site collection performance is designed to analyze data from many SharePoint site collections. As we’ve mentioned before, to get the most out of it, you need to add meta sites that combine data from multiple sites.
In this section, you’ll find the following reports:
- Engagement: This report shows traffic grouped by office and department and lets you analyze user engagement by job title and user ID.
- Content usage: This report helps you understand how people are using pages, files and lists across all SharePoint sites. It reports on views, openings, likes, shares and more.
- Popular content: This report shows the most trending pages grouped by SharePoint sites (
Website namein Piwik PRO). - Internal search: This report shows what was searched for in the SharePoint search engine. Reporting is grouped by SharePoint sites (
Website namein Piwik PRO).
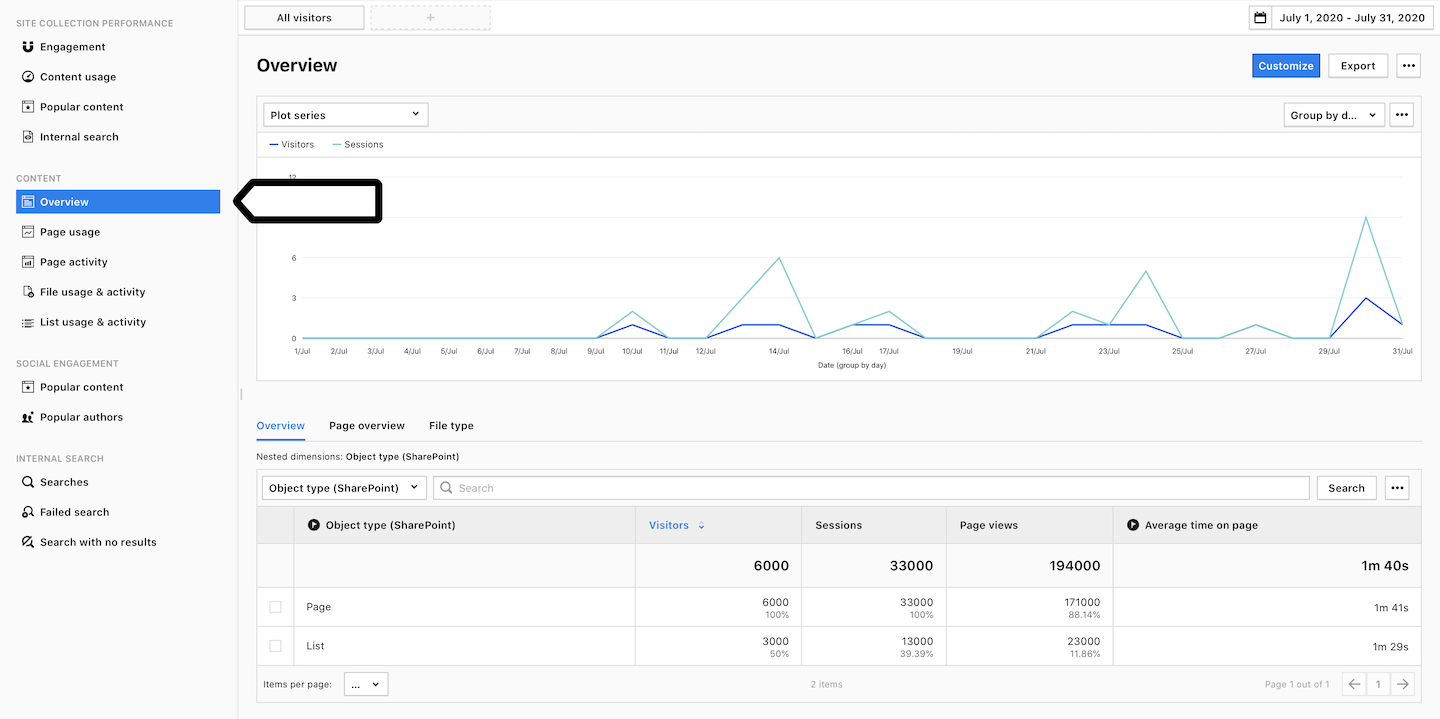
Content
Content was created to help you analyze how pages, lists and files are used, edited and shared in SharePoint. In most sections, reports have been grouped by office, department, job title and user ID to give you a more granular perspective.
In this section, you’ll find the following reports:
- Overview: This report gives you a high-level view of how people are using content on a single SharePoint site.
- Page usage: This report tells you how people are using, sharing and promoting your pages. It includes a section with the content type, which can be a site page, a news page, a wiki or a default type created by a SharePoint user. Reporting is also grouped by office, department, job title and user ID.
- Page activity: This report shows what changes people are making to pages, such as publishing, editing or deleting a page. It also includes a section dedicated to tracking page shares and promotions.
- File usage & activity: This report focuses on how people are creating, using, sharing and deleting files. Reports are grouped by file URL, file type, office, department, job title and user ID.
- List usage & activity: This report focuses on how people are creating, using, sharing, and deleting lists. Reports are grouped by file URL, file type, office, department, job title and user ID.
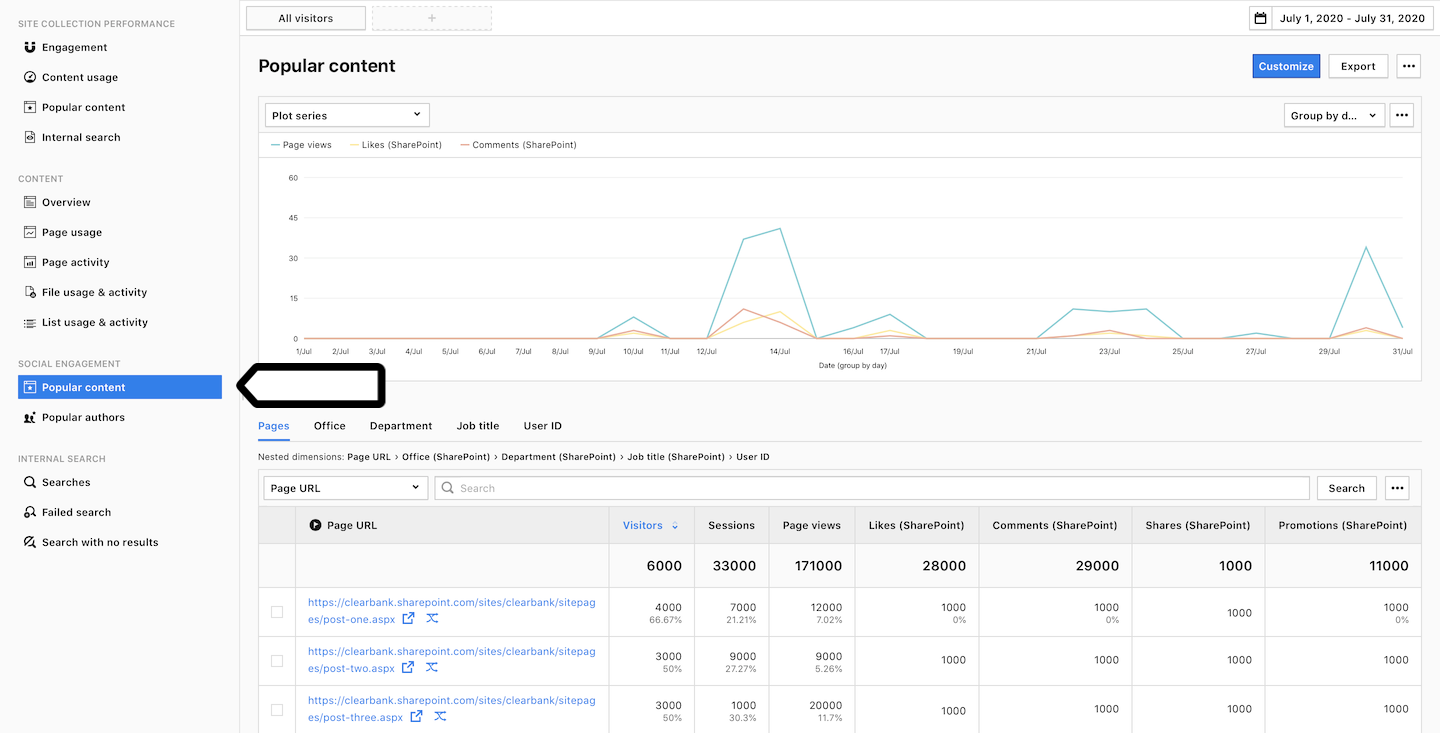
Social engagement
Social engagement is intended to help you monitor social interactions with pages, such as likes, comments and shares. This report shows the most engaging content and most popular authors. It shows data grouped by office, department, job title and user ID for a more granular view.
In this section, you’ll find the following reports:
- Popular content: This report shows which sites are popular among SharePoint users.
- Popular authors: This report pinpoints popular authors who create content on your SharePoint site.
Internal search
Internal search is designed to help you see what people are searching for in SharePoint search engine and how they click on search results. Reports have been grouped by keywords, categories, pages clicked, office, department, job title and user ID.
In this section, you’ll find the following reports:
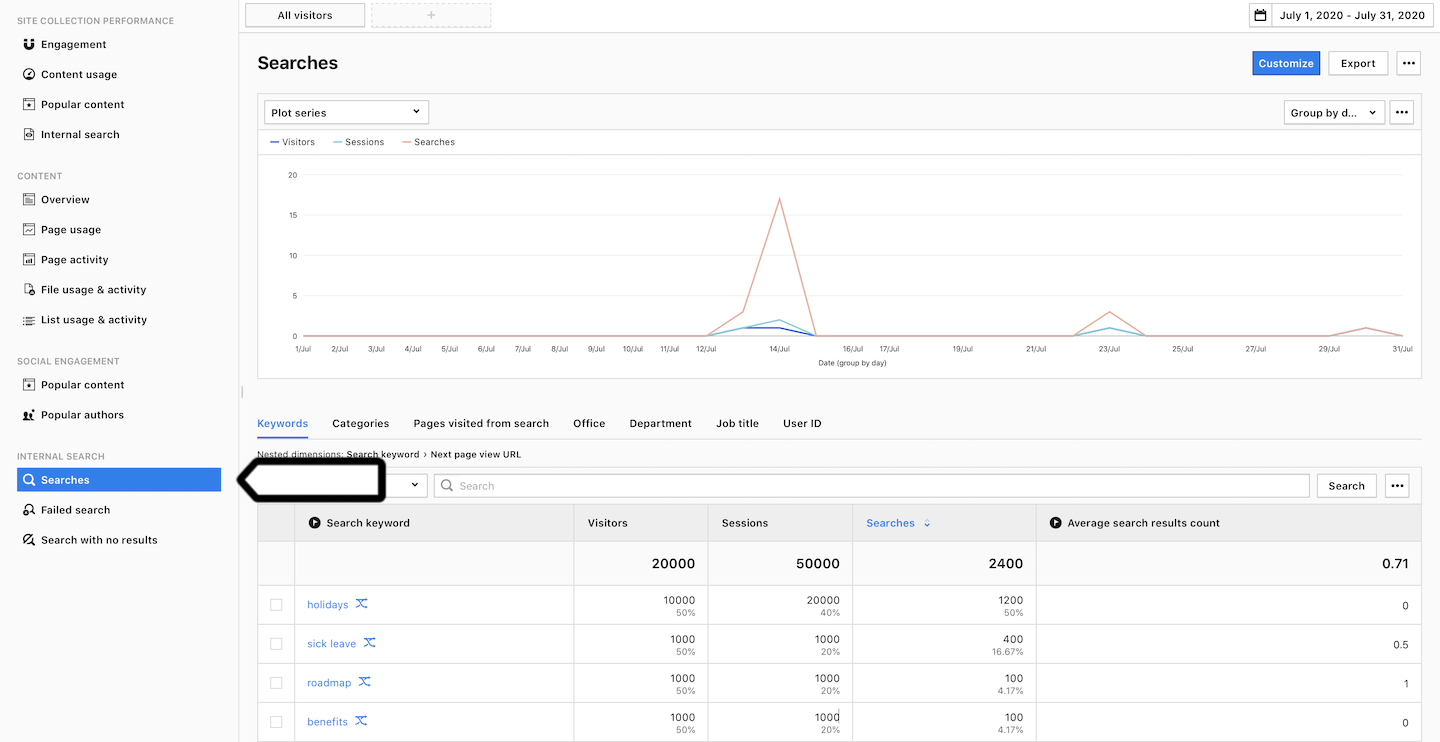
- Searches: This report tells you what keywords people are using in the search engine and where they are clicking. You can also see who (user ID) searched for what.
- Failed search: This report shows you keywords that didn’t result in a click. In other words, people searched for something but left the page with the search results.
- Search with no result: This report shows you keywords that are not generating search results and helps you identify content that may need to be added to your knowledge base.
SharePoint metrics
The table below describes the metrics you’ll find in your SharePoint reports.
| Metric name | Description |
|---|---|
| Likes (SharePoint) | The number of likes that content has received. It doesn’t include comment likes. |
| Shares (SharePoint) | The number of shares such as: Copy link or Send message. |
| Comments (SharePoint) | The number of posted comments and comment replies. |
| Promotions (SharePoint) | The number of page promotions such as: Add page to navigation, Post as news, Save as template. |
| Creations (SharePoint) | The number of page creations. |
| Edits (SharePoint) | The number of object edits. The edit is counted when a user edits a page, file and the like. |
| Deletions (SharePoint) | The number of object deletions. The deletion is counted when a user deletes a page, file and the like. |
| File openings (SharePoint) | The number of file openings. The file opening is counted when a user clicks a file in SharePoint to open it. It doesn’t include openings of attachments from list items. (See: Item attachment views) |
| Uploads (SharePoint) | The number of uploaded files. |
| Item views (SharePoint) | The number of item views. The item view is counted when a user sees an item on the list by clicking on it or entering a direct URL. |
| Item attachment views (SharePoint) | The number of item attachment views. The item attachment view is counted when a user views an item attachment on the list by clicking on it. |
| Item shares (SharePoint) | The number of shares of items on the list. |
Tip: See a full list of SharePoint dimensions and SharePoint metrics.