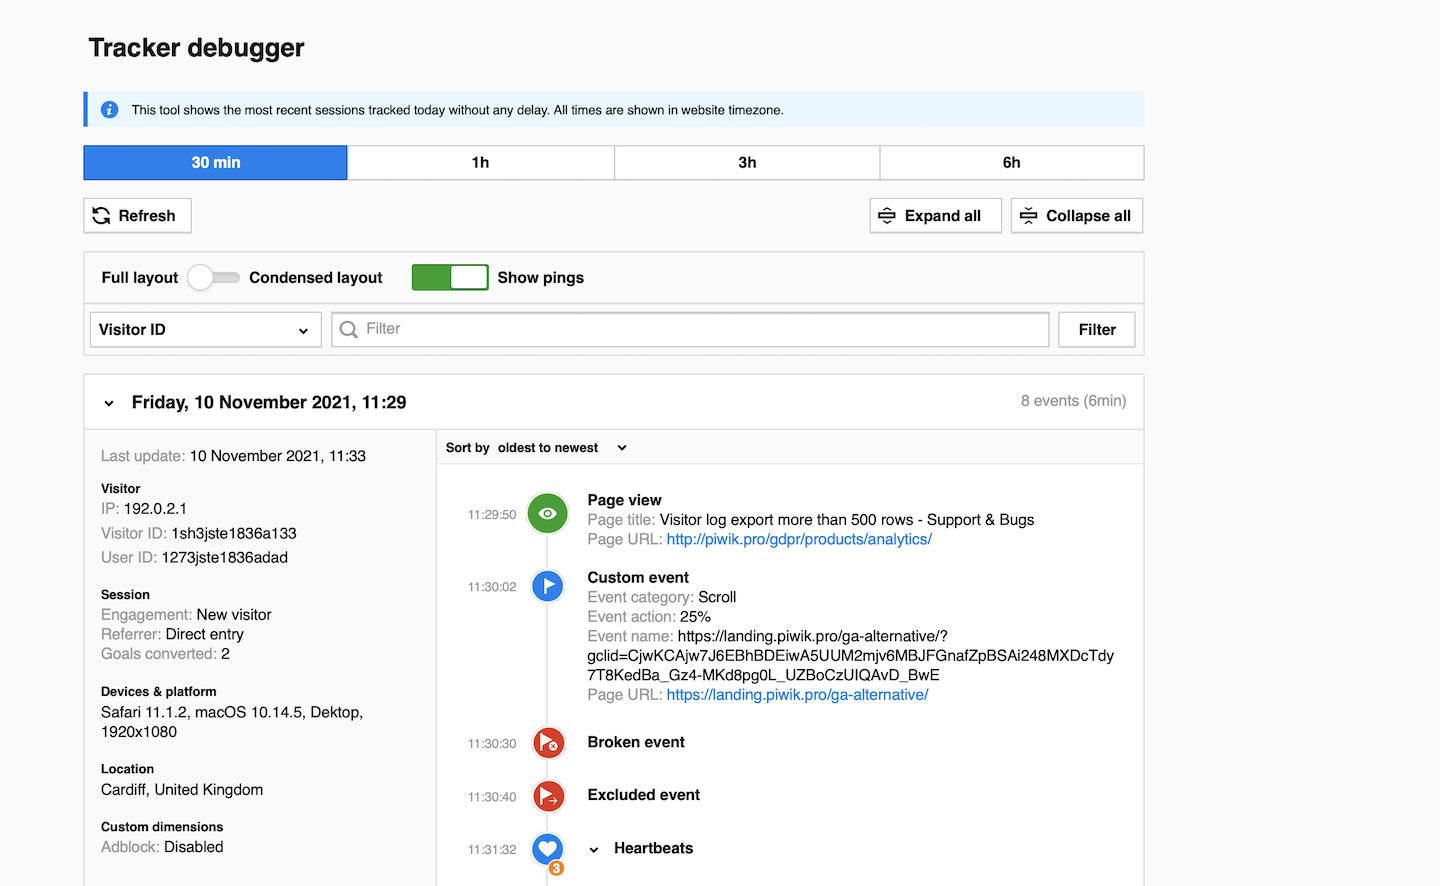
The tracker debugger is a tool that helps you check your website tracking. It displays information about visitor sessions and events that took place within the last six hours. If you’ve made changes to your tracking setup, you can use the tracker debugger to confirm that the data is being collected accurately.
To use the tracker debugger, follow these steps:
1. Go to Menu > Analytics.
2. Navigate to Settings.
3. On the left, click Tracker debugger.
4. Done! You can now access the recorded sessions.

Note: The tracker debugger shows sessions from the last six hours. All times are shown in site’s or app’s time zone.
Check your tracking
To see if your tracking is working correctly, follow these steps:
1. Open the website you want to track with Piwik PRO.
2. Consent to all tracking purposes.
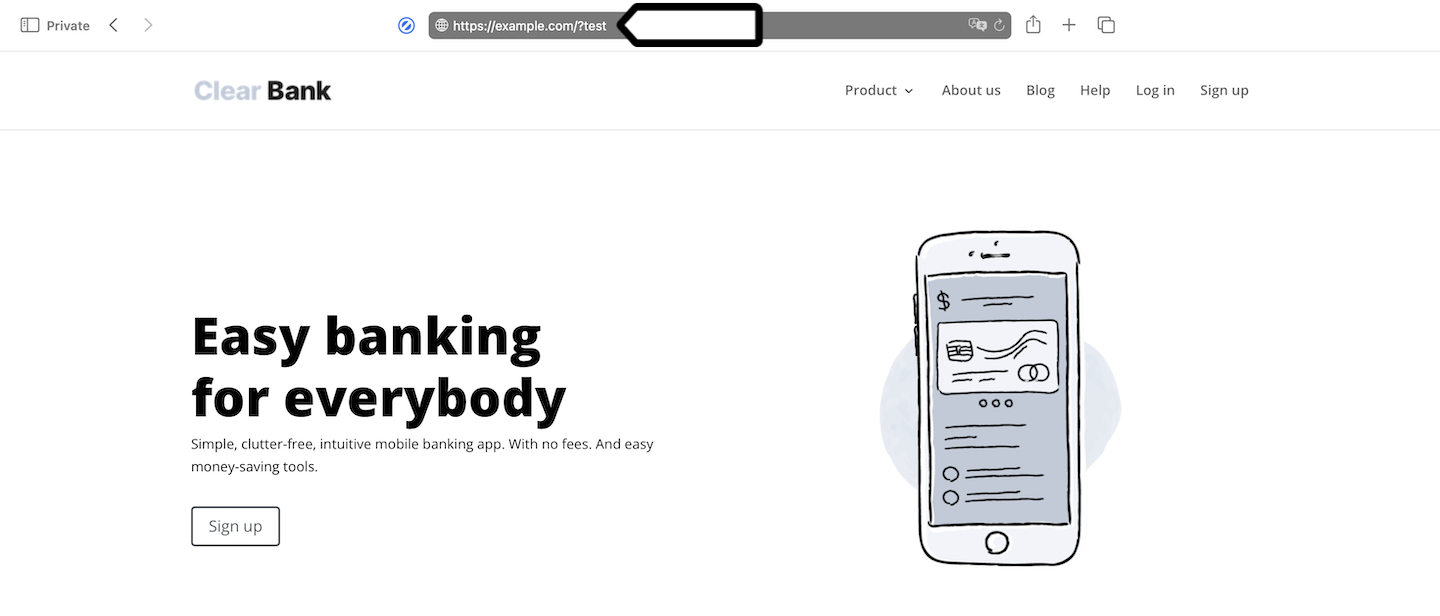
3. Add a random parameter to your page URL and reload it. Example: https://example/?test.

Note: Another way to find your session is to search for visitor ID. Read more
4. Copy the URL with the parameter.
5. Log in to Piwik PRO.
6. Go to Menu > Analytics.
7. Navigate to Settings.
8. On the left, click Tracker debugger.
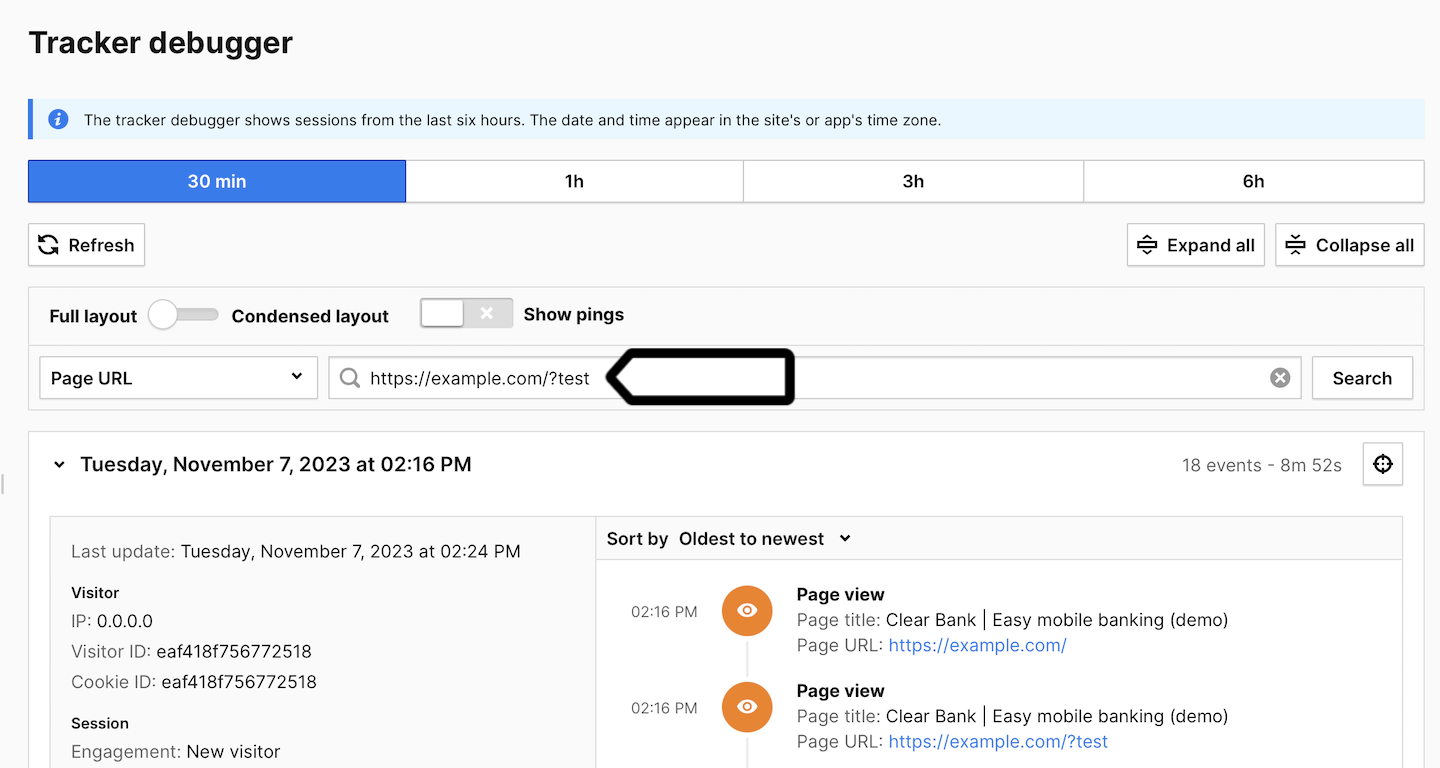
9. Paste the URL with the parameter into the session filter.

10. If website tracking is working correctly, you’ll see your current session and all the events performed.

11. All done!
Tip: For more ways to check tracking, read this article.
