There are three ways to see if your website tracking is working correctly: with tracker debugger, debug mode in Tag Manager or an inspector tool in the browser.
In this article, we’ll explain how to work with each of these methods.
Using tracker debugger in Analytics
To check website tracking with the tracker debugger, follow these steps:
1. Open the website you want to track with Piwik PRO.
2. Consent to all tracking purposes.
3. Add a random parameter to your page URL and reload it. Example: https://example/?test.
Note: Another way to find your session is to search for visitor ID. Read more
4. Copy the URL with the parameter.
5. Log in to Piwik PRO.
6. Go to Menu > Analytics.
7. Navigate to Settings.
8. On the left, click Tracker debugger.
9. Paste the URL with the parameter into the session filter.
10. If website tracking is working correctly, you’ll see your current session and all the events performed.
11. Done!
Using debug mode in Tag Manager
To check website tracking in debug mode, follow these steps:
1. Go to Menu > Tag Manager.
2. Choose the site or app you want to work with. Use the site/app picker in the upper right corner.
3. Go to Debug mode.

4. In Your site address, type in or select your site or app address.
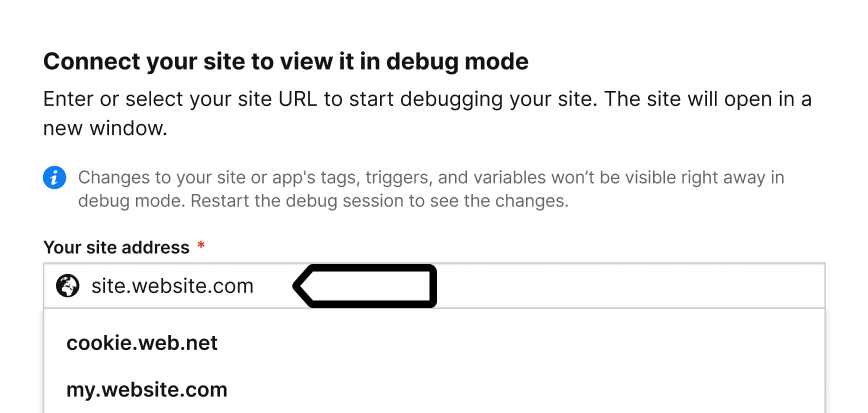
5. Click Connect.
6. Once your site is connected, it will open in a new tab.
Note: If you have any trouble connecting, check that:
- The installation code matches the site or app selected in the picker at the top right.
- Your browser allows popups. Some browsers, for example Safari, block them by default.
- The necessary code is installed on your site.
- You entered the correct site address.
- Ad blockers are turned off.
7. To check if the tag named Piwik PRO was fired, go back to Tag Manager > Debug mode.
Note: Piwik PRO tag is a default tag necessary for basic tracking.
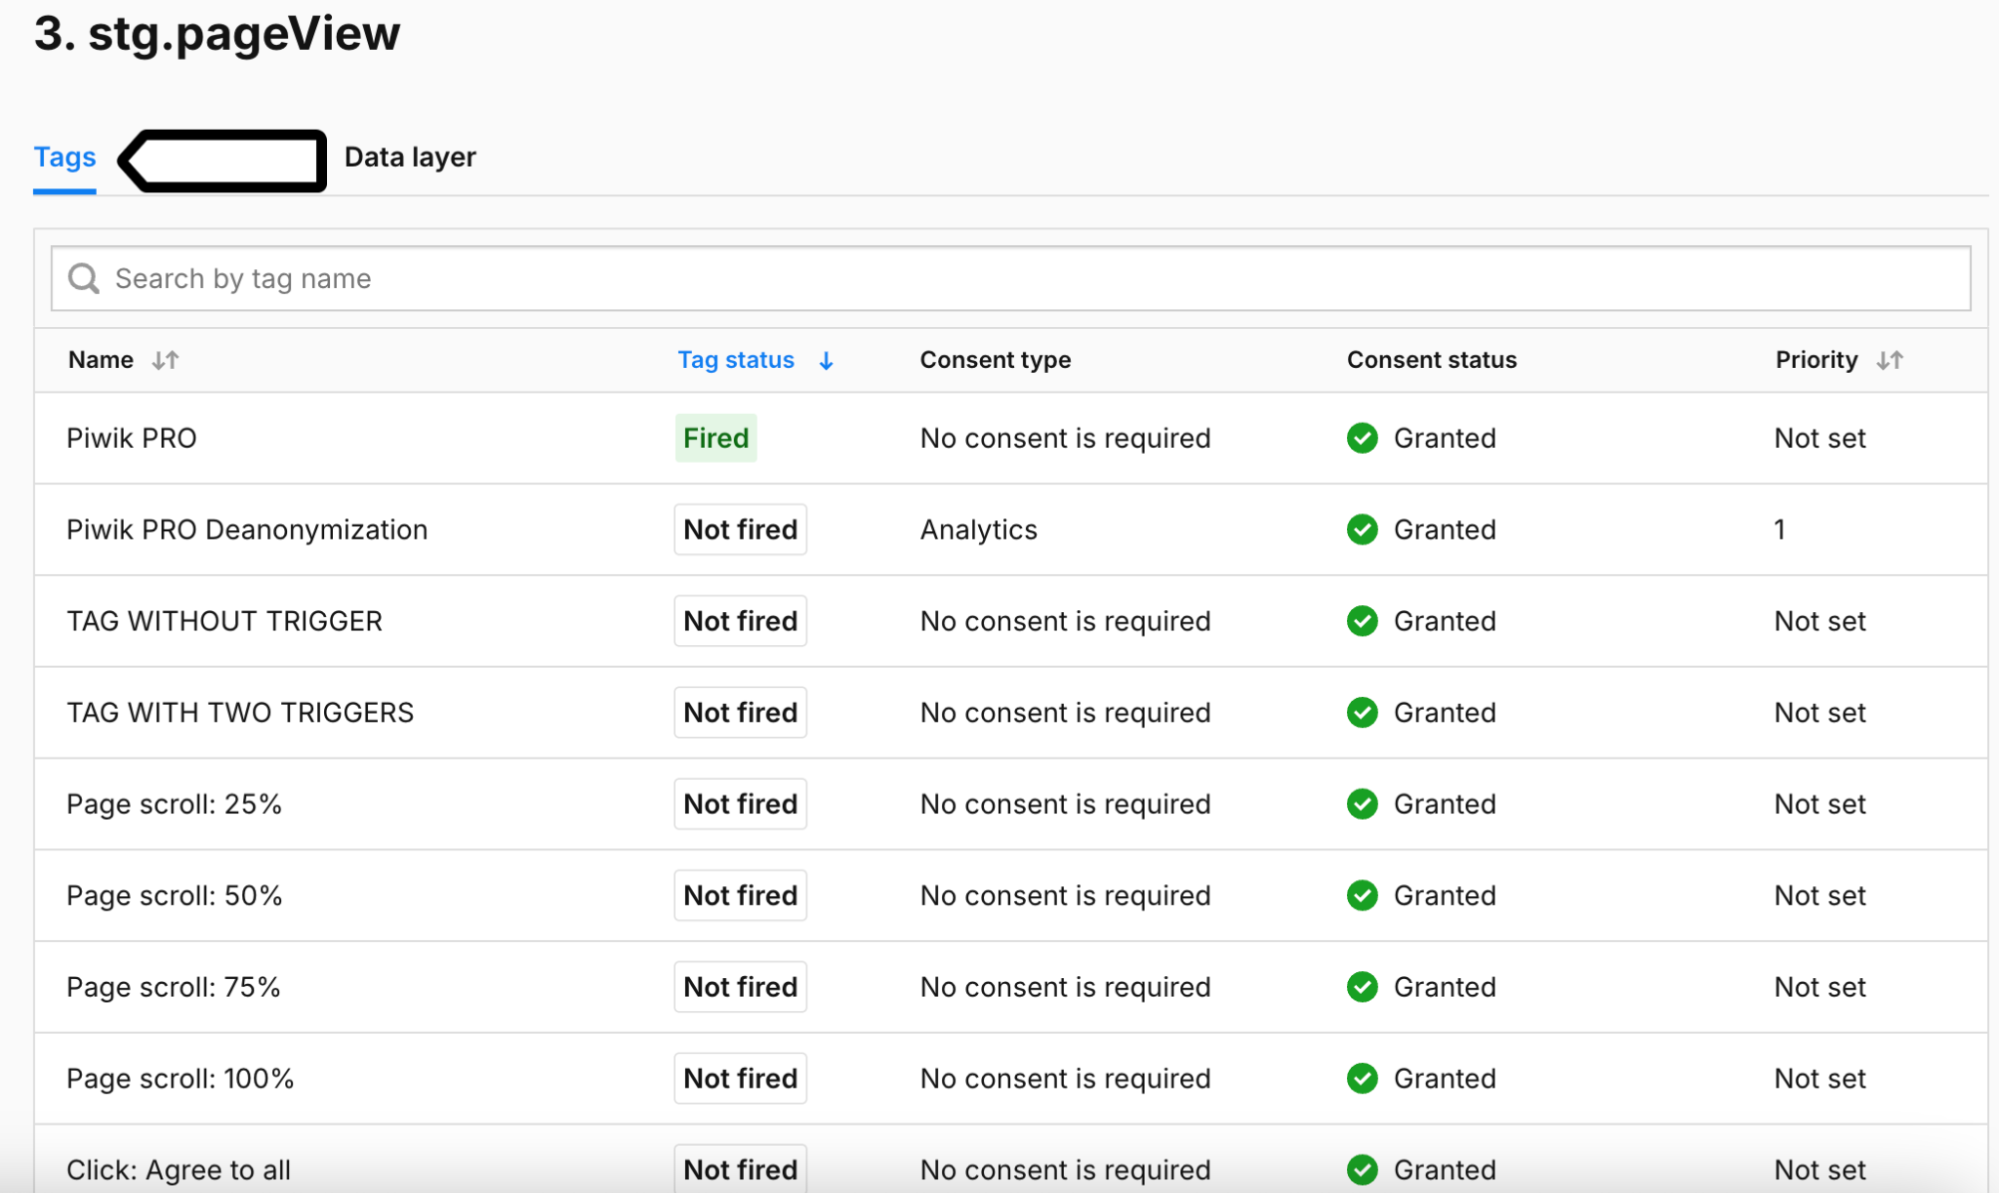
8. In Tags, see all the tags that fired. Example: Piwik PRO.
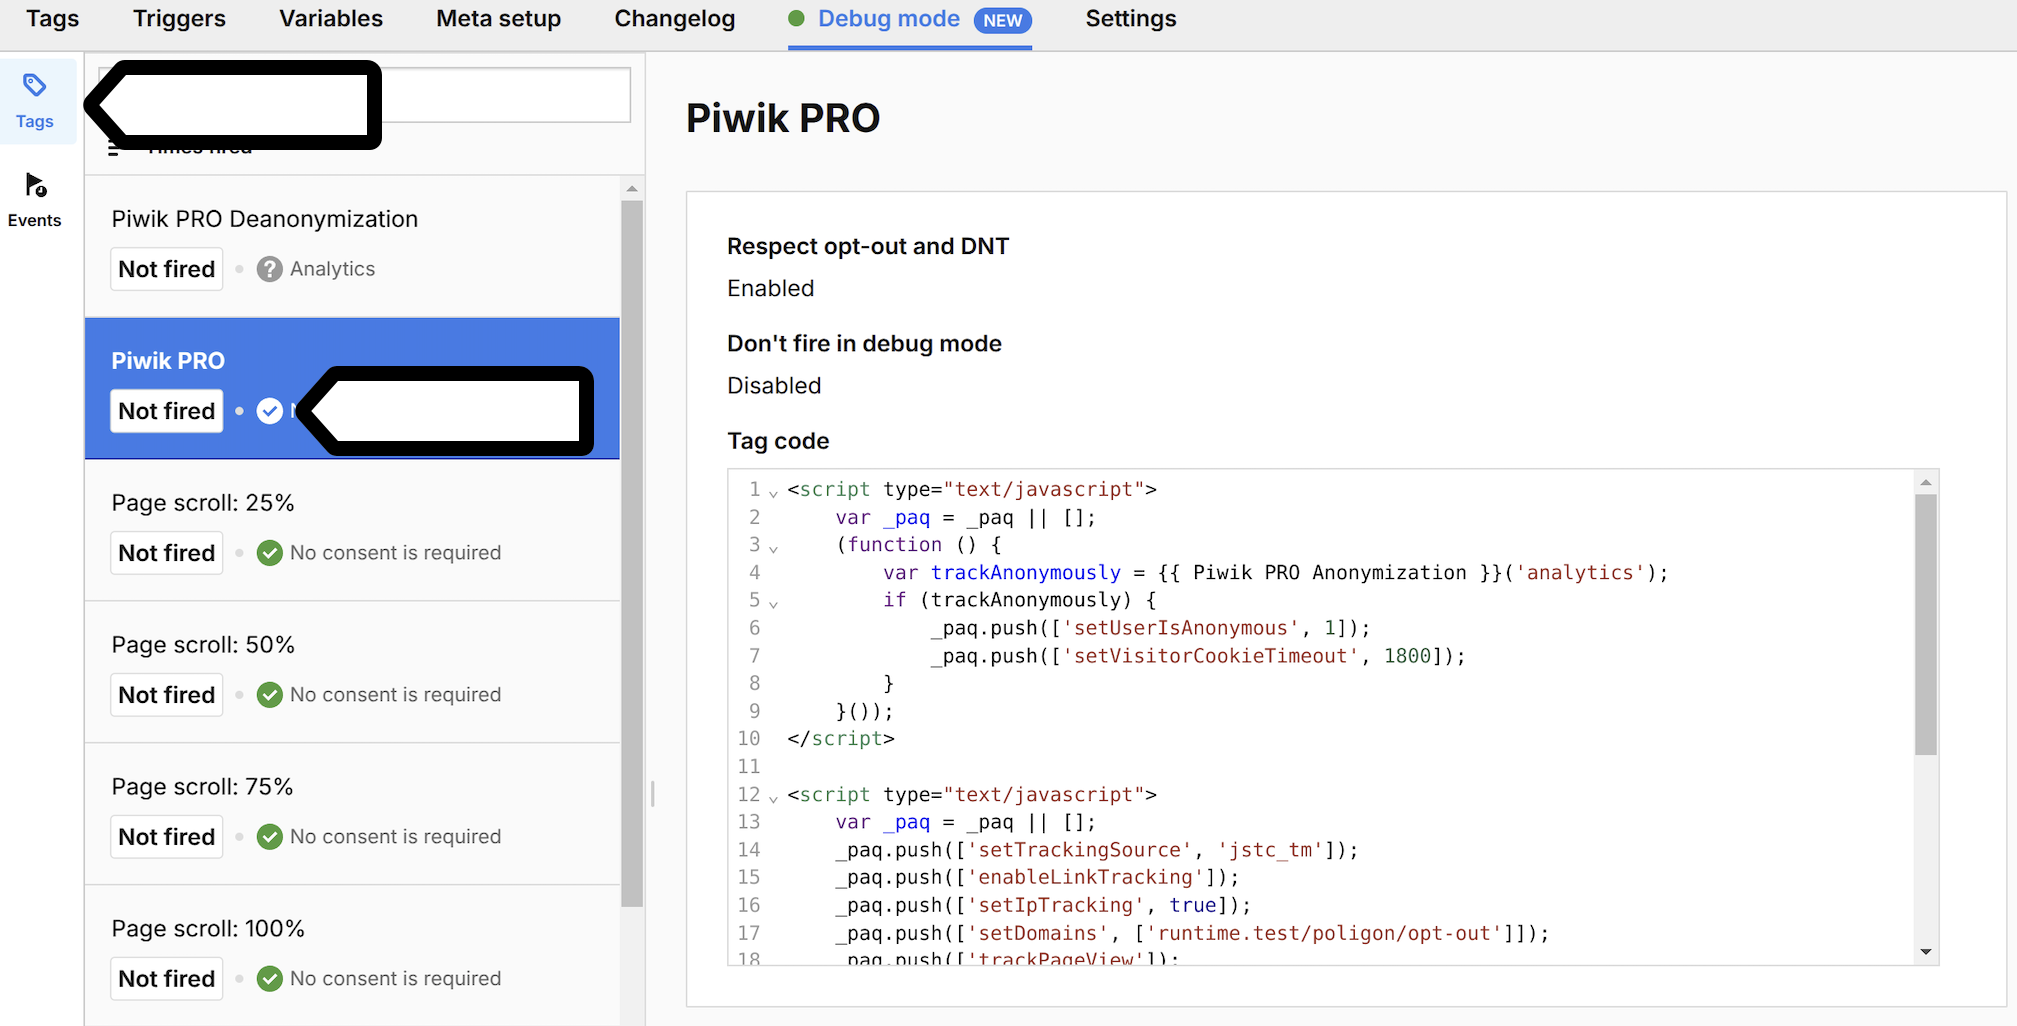
9. Click Piwik PRO to see tag details such as setup, triggers, and what event it fires on.
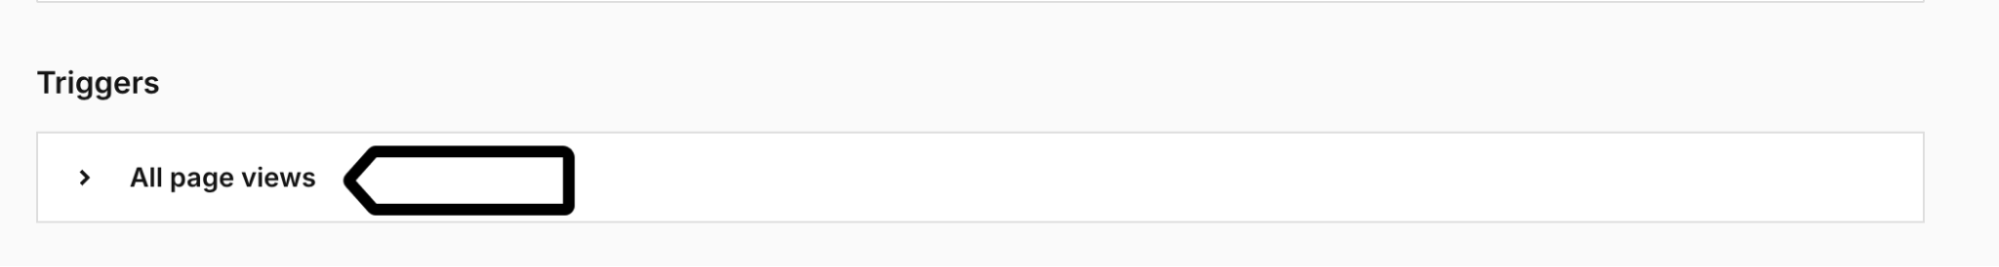
10. If the tag wasn’t fired, check to see if the trigger is set as All page views. You may also need to check the trigger’s conditions.
11. Navigate to Events.
12. Find a stg.pageView element on the event list and click it.
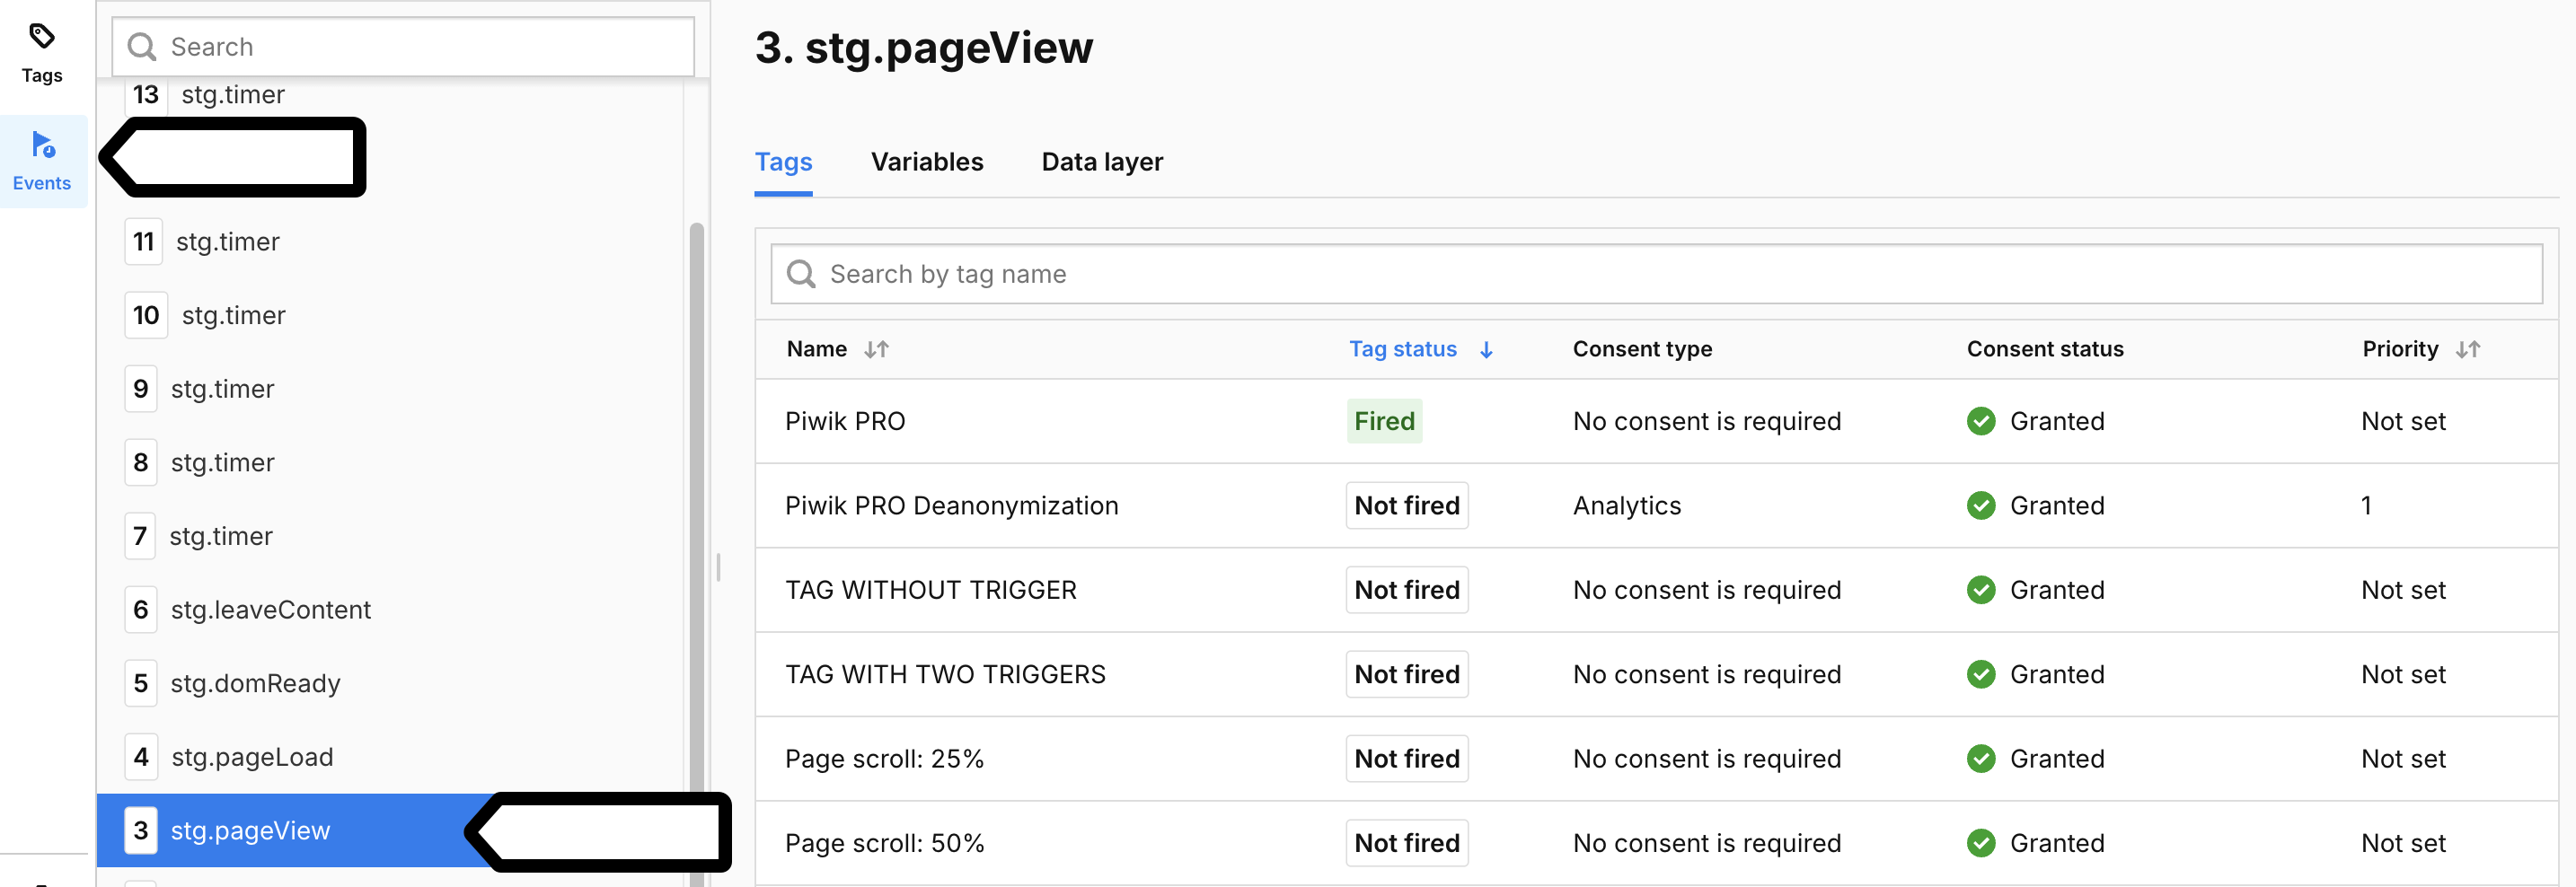
13. Here you’ll see all tags that were fired. If the Piwik PRO tag is among them, the website tracking is working correctly.
14. Done!
Using an inspector tool in the browser
To check website tracking using an inspector tool in the browser, follow these steps:
1. Open your website.
2. Right-click on any element on the website and click Inspect or Inspect Element, depending on the browser you’re using.
3. Navigate to Network.
4. Refresh the browser.
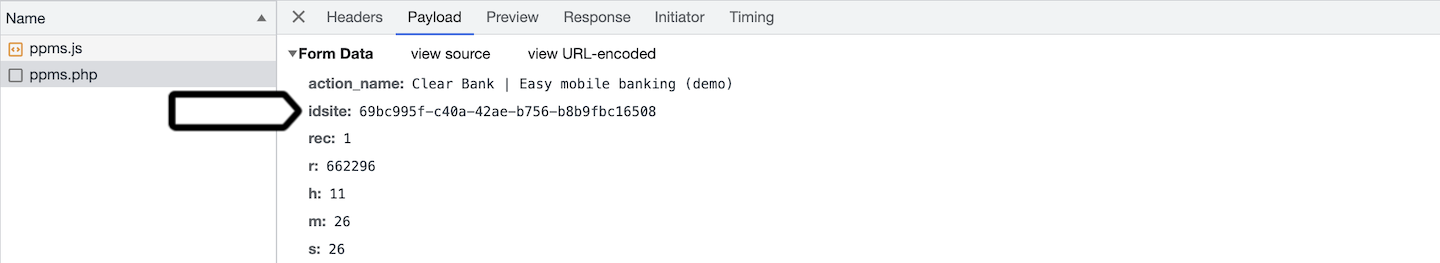
5. Find the ppms.php element on the network list.
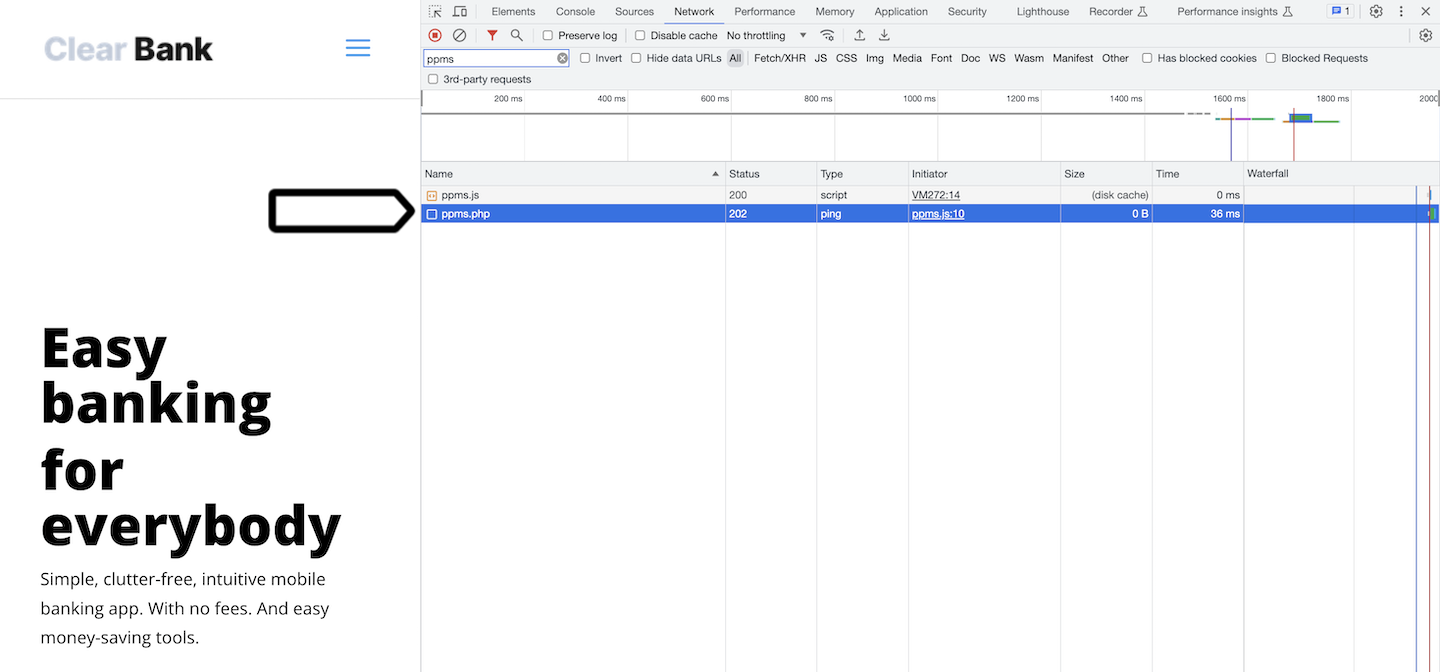
Tip: You may see two types of ppms.php elements: ppms.php?action-name= and ppms.php?ping=. Action-name is a page view request. Ping is a request to see if the visitor’s session is still active. The frequency of the ping is set in Piwik PRO tag settings.
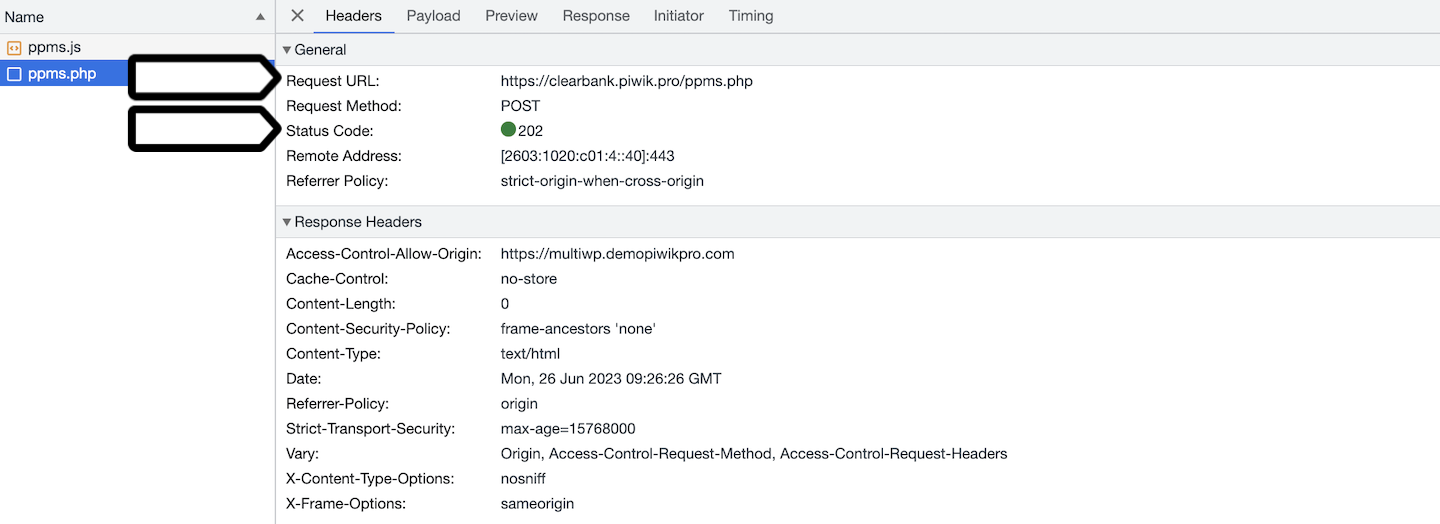
6. Click ppms.php and check the following items:
- Status code: 202. This means that tracking is working correctly.
- Request URL: This is your Piwik PRO account address.
7. Navigate to Payload and check the site ID. It should match the site/app ID you’ve got in Piwik PRO (Where to find it?).
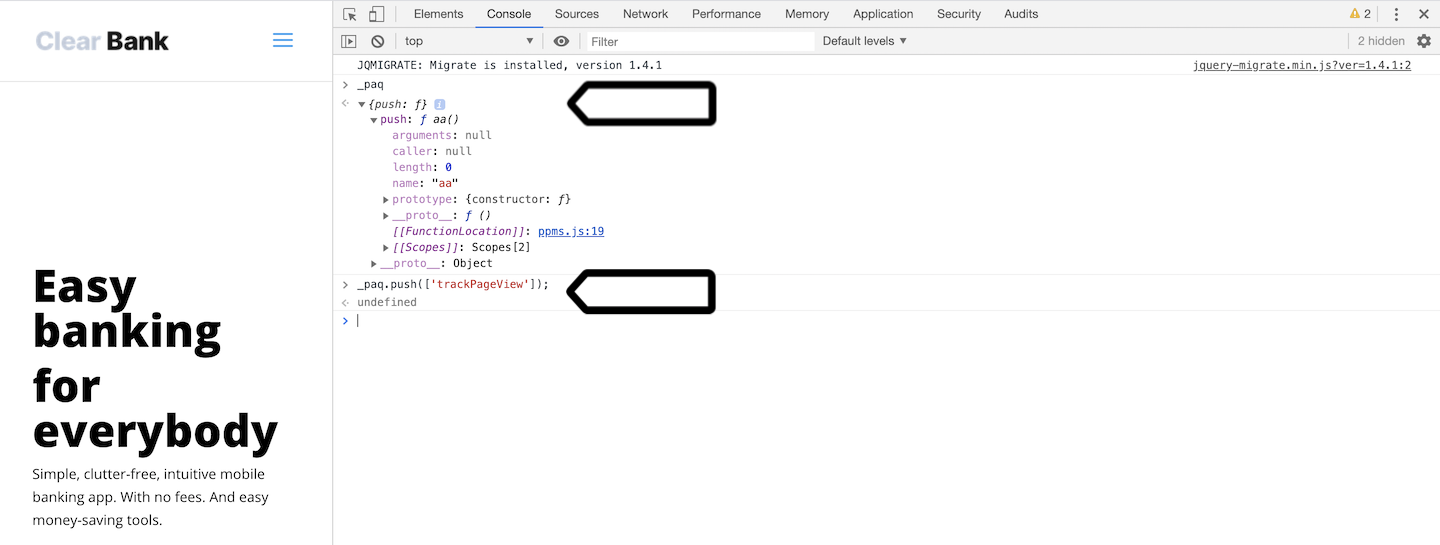
8. If you need further information, navigate to Console.
9. If the tracking code is broken, you’ll see an error message in the console.
10. In Console, you can also use the following calls:
_paq: if the call returns_paq.pushtracking is working correctly._paq.push(['trackPageView']);: if it returns undefined tracking is working correctly.
Tip: You can also use an inspector tool to check cookies set by Piwik PRO in your browser. Navigate to Application > Cookies and look for cookies listed here.
11. Done!
Reasons for broken tracking codes
If you find a broken tracking code on your website, it’ll be because of one of the following issues:
- Piwik PRO tag, which is responsible for tracking, is turned off.
- Trigger for the Piwik PRO tag is incorrect. It should be set as
All page viewswith no additional conditions. - Tracking code has not been installed properly. For more on installing tracking codes, read this article.