A user flow report shows you paths that people use when they navigate your website. It lets you choose a key interaction and see previous and next interactions. For example, if a signup-page view is your key interaction, you can see which pages led visitors to that page and where they went after visiting it.
In this article, we’ll walk you through three different types of the user flow report:
- Standard report: Shows the key interaction and the next interactions.
- Transition report: Shows the key interaction and the previous and next interactions.
- Reverse report: Shows the key interaction and the previous interactions.
Before you start
Here are a few things to know before you start:
- You can set up interactions like a page view, download, search, custom event and so on.
- You can break down your report by dimensions like the channel, referrer, campaign and so on.
- Each report displays the top path, which is the most frequently used route by visitors.
- You can add up to five previous and five next interactions in your report. (
Enterprise planIf you need more interactions, contact your account manager.) - The report has two modes: strict and non-strict. In strict mode, Piwik PRO looks at the exact sequence of events. In non-strict mode, Piwik PRO skips events that don’t match the filtered interaction. Read more
- The key interaction decides which sessions get included in the report. If a session has multiple events that match the conditions and filters of the key interaction, we’ll always consider the first event in that session as the key interaction. This is why the numbers in the report can change when you switch the key interaction.
Set up a standard user flow report
Let’s say we’re analyzing the user behavior on our Clear Bank demo blog. We want to know how visitors navigate the website and whether they sign up for the newsletter that is promoted on each blog post. A standard user flow report is the perfect tool to help us visualize this information. It’ll show visitors’ paths and newsletter signups.
To set up a standard user flow report, follow these steps:
1. Go to Menu > Analytics.
2. Navigate to Custom reports.
3. Click Add a report.
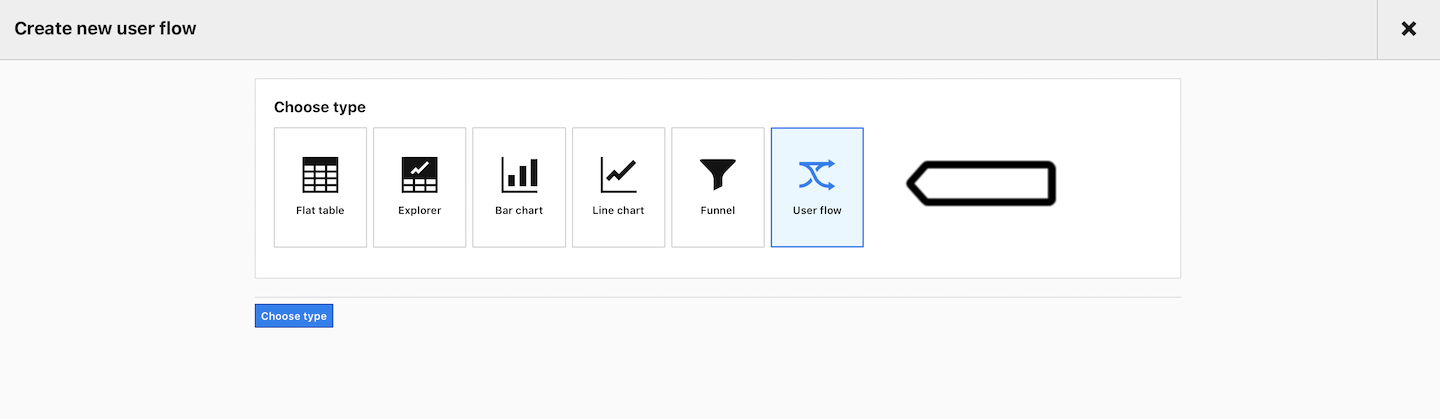
4. Select the following report type: User flow.
5. Name the report.
6. In Visibility, choose: Author or All users. All users lets you share this dashboard with your teammates.
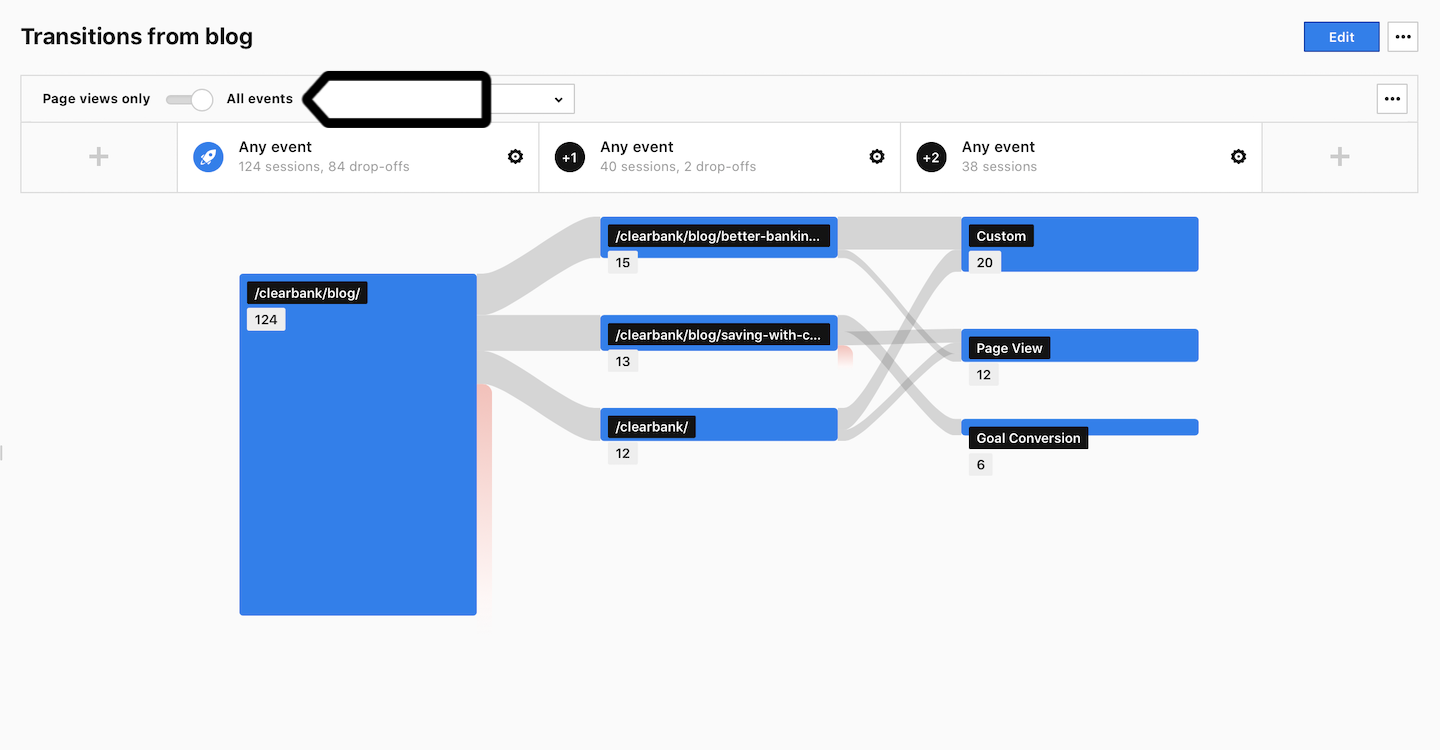
7. Toggle All events. (We use All events because we want to see newsleter signups, which are events.)
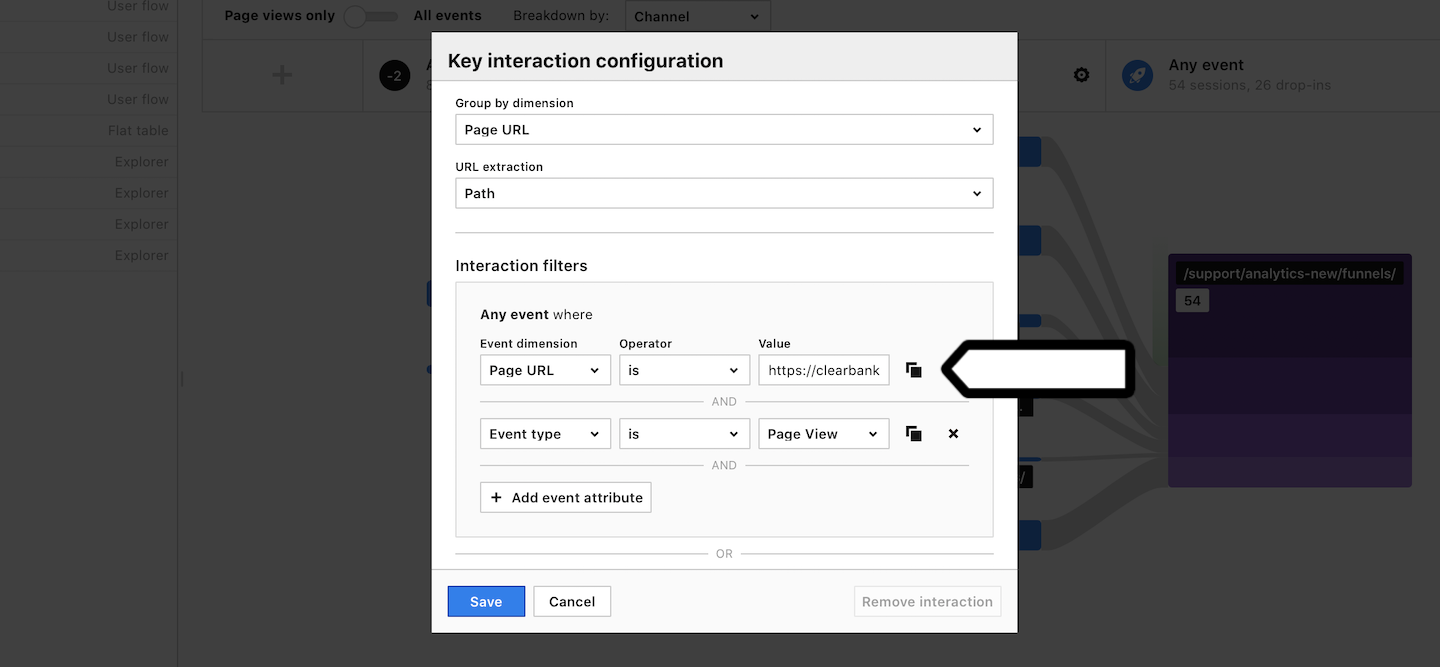
8. Click the ⚙ setting icon next to the key interaction.
9. Set up conditions for the key interaction. Example: Page URL is https://clearbank.com/blog/.
10. On the right, click + to add next interactions.
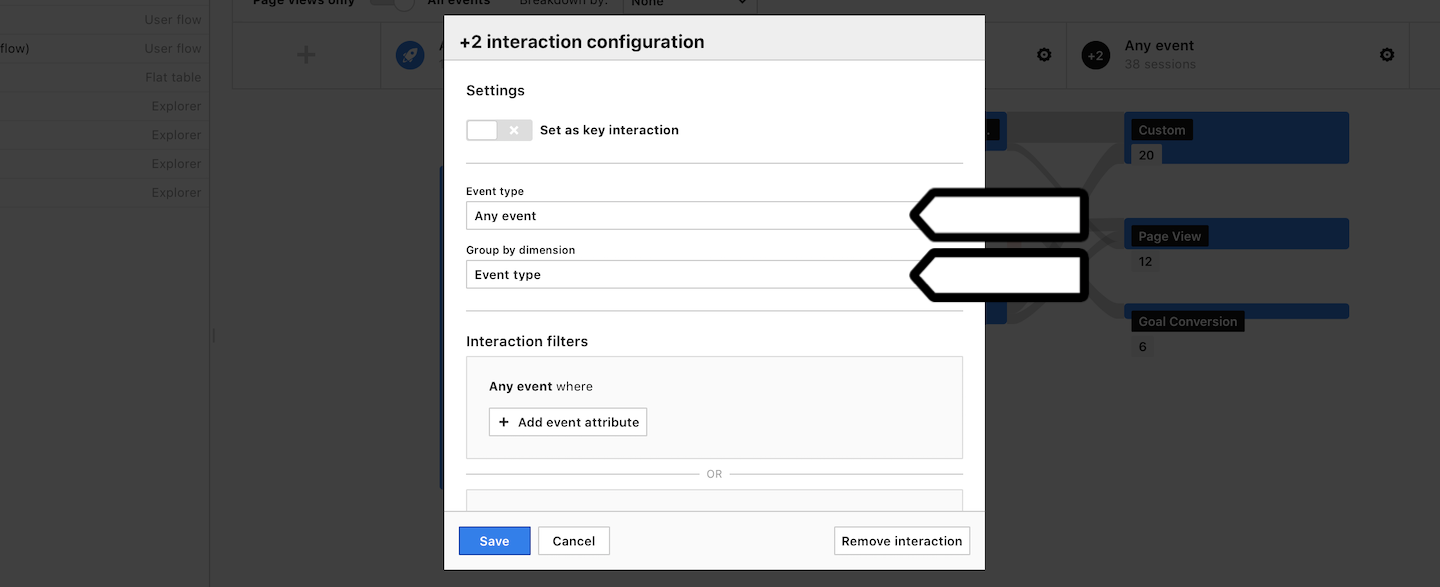
11. (Optional) Set up conditions for the previous interactions. In our case, we’ll set two conditions for the +2 interaction: Event type is any event and Group by event type.
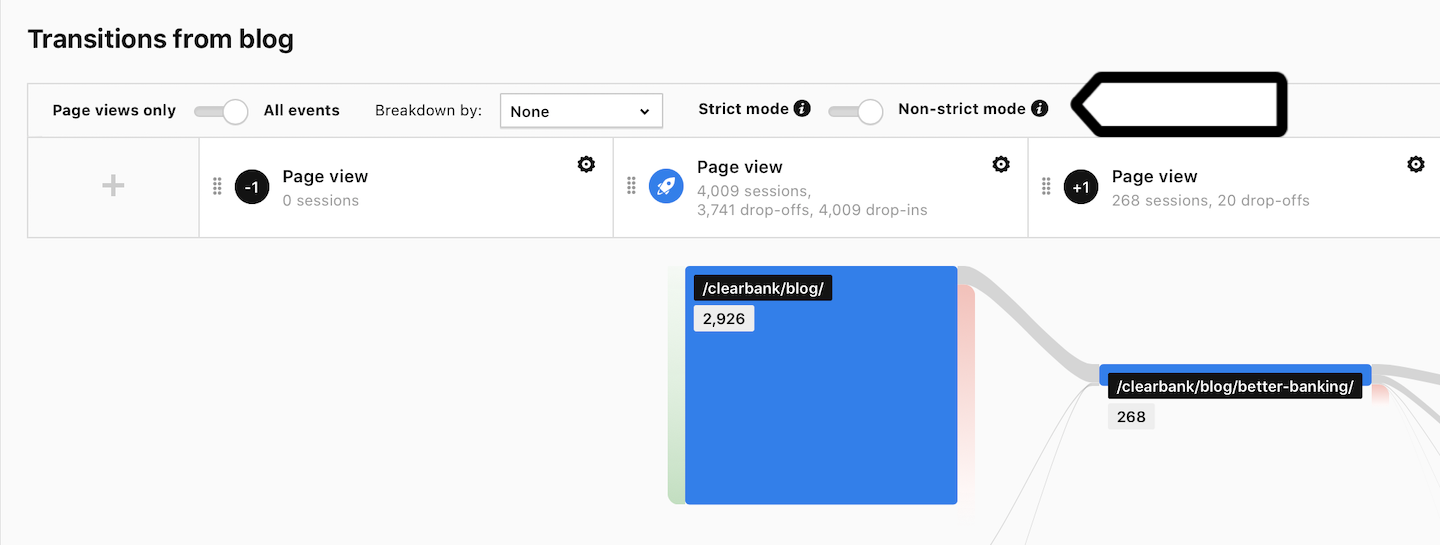
12. (Optional) Toggle Non-strict mode. By default, Piwik PRO looks at all events in sequence. When you turn on the non-strict mode, Piwik PRO will skip events that happened before the filtered event.
Tip: For more about strict and non-strict mode, read this article.
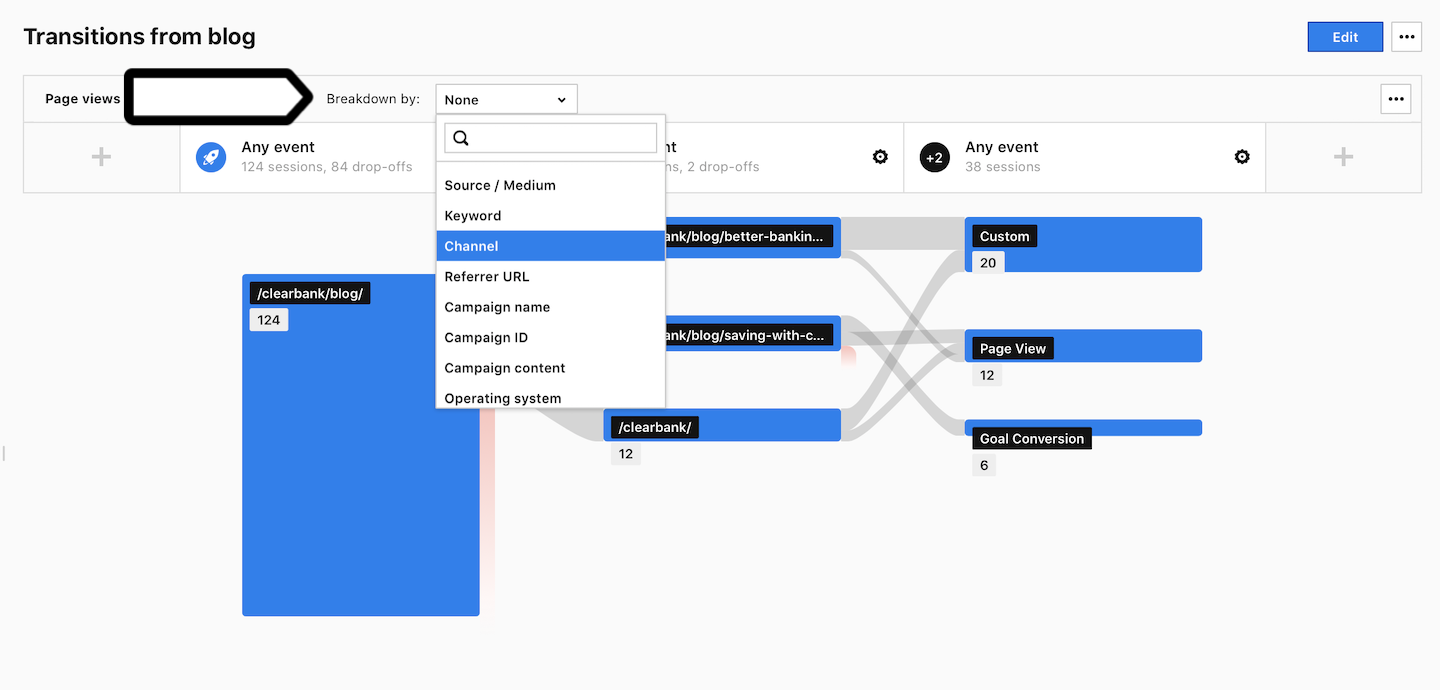
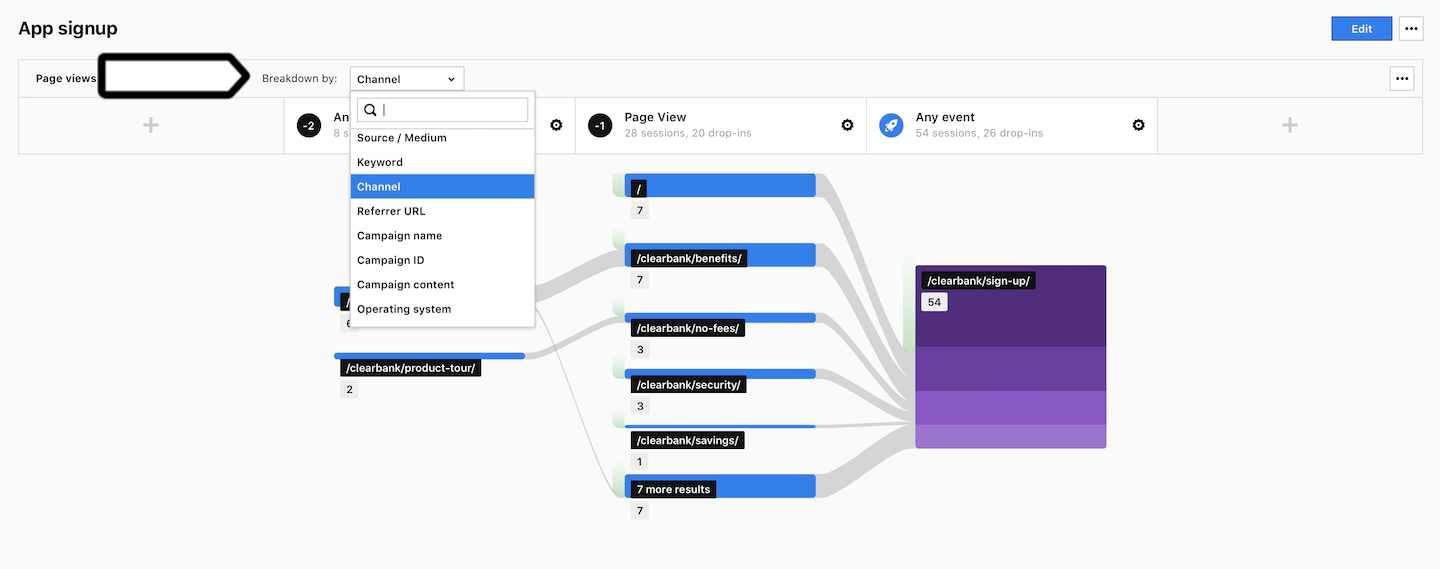
13. (Optional) Break down your report by dimensions. Example: Breakdown by channel.
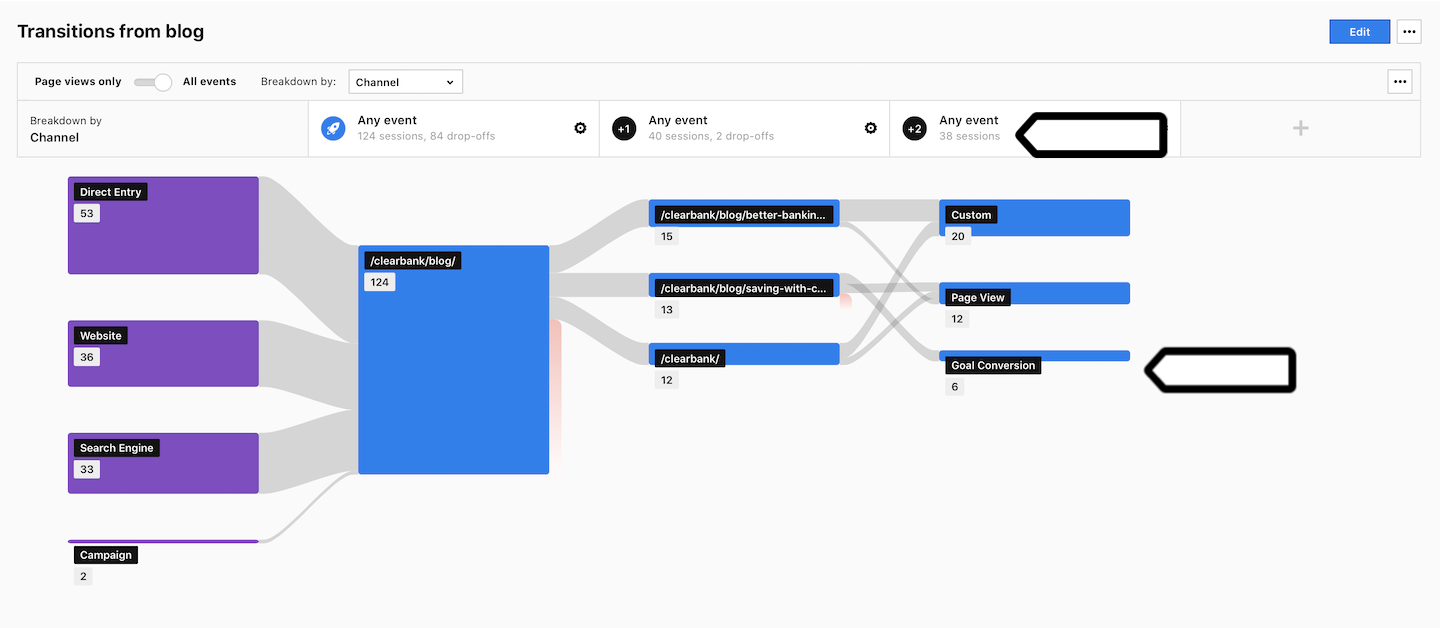
14. All set! Now it’s time to analyze your report. And let’s look at our example:
- Key interaction: 124 sessions have been recorded and 84 dropped off
- +1 interaction: 40 sessions continued to this step and 2 dropped off
- +2 interaction: 38 sessions continued and 6 sessions resulted in newsletter signup (goal conversion)
Tip: To add filters to a user flow report, go to Edit > Flow filters.
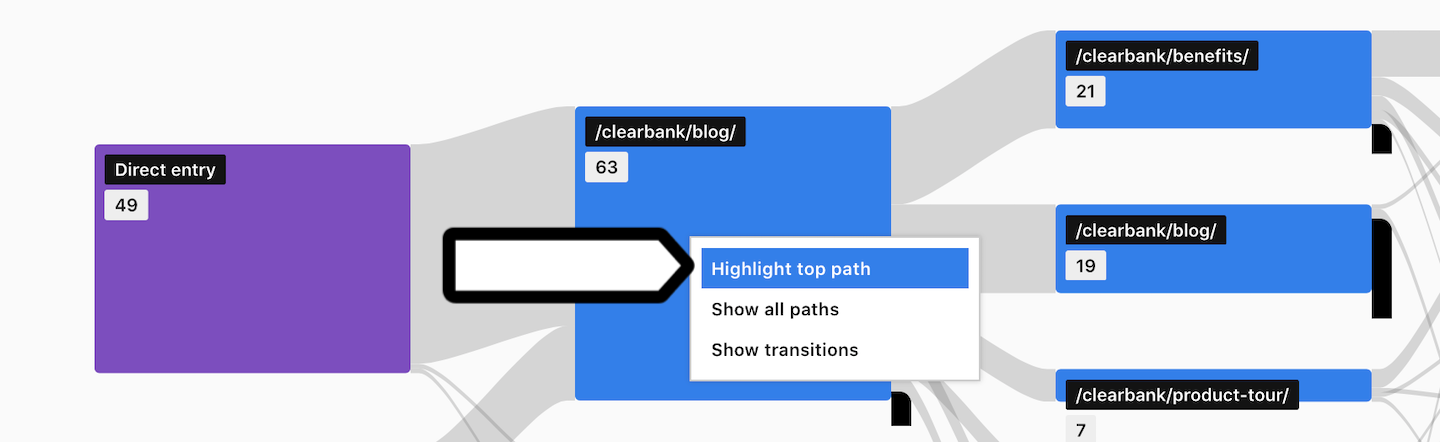
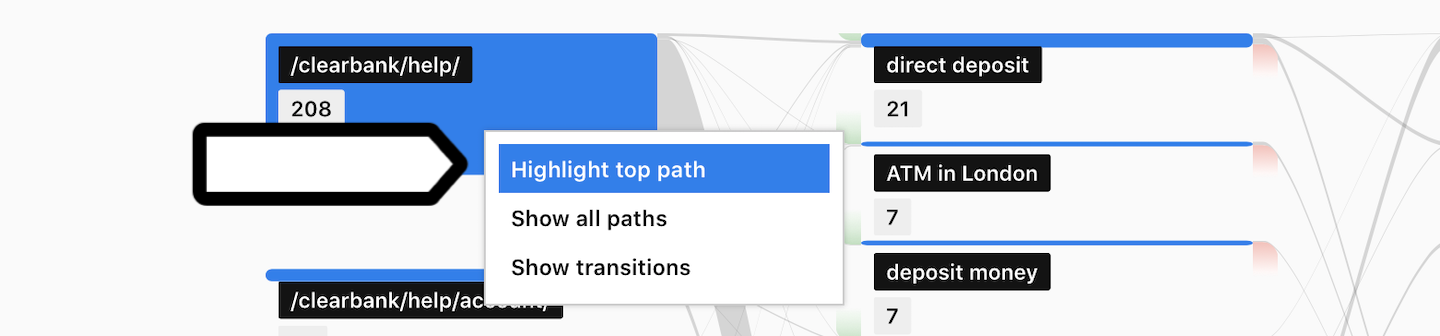
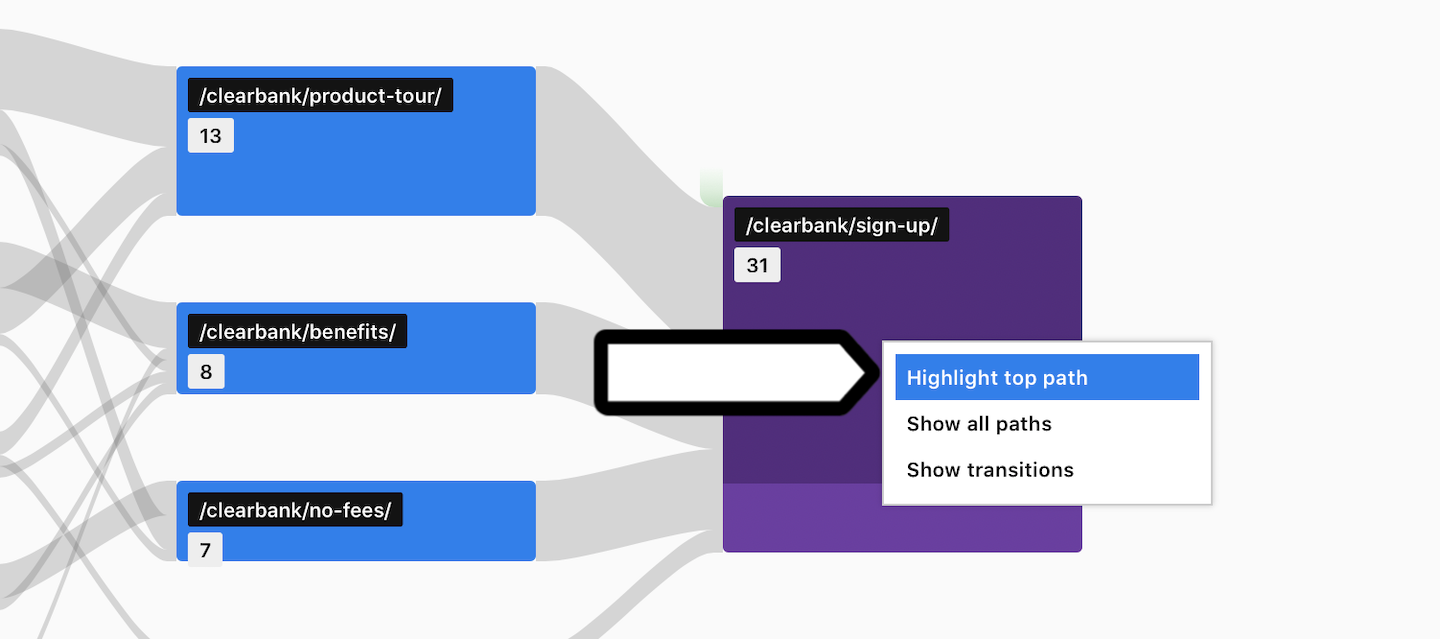
15. Click Highlight top path to see the most used path.
Set up a transition user flow report
Now let’s take a look at our Clear Bank demo help center where customers can search for support articles. We want to understand when people use the search engine, what keywords they’re searching for and where they end up after the search. A transition user flow report is the perfect tool to help us gain these insights. It will show visitors’ paths in the help center and interactions with the search engine.
To set up a transition user flow report, follow these steps:
1. Go to Menu > Analytics.
2. Navigate to Custom reports.
3. Click Add a report.
4. Select the following report type: User flow.
5. Name the report.
6. In Visibility, choose: Author or All users. All users lets you share this dashboard with your teammates.
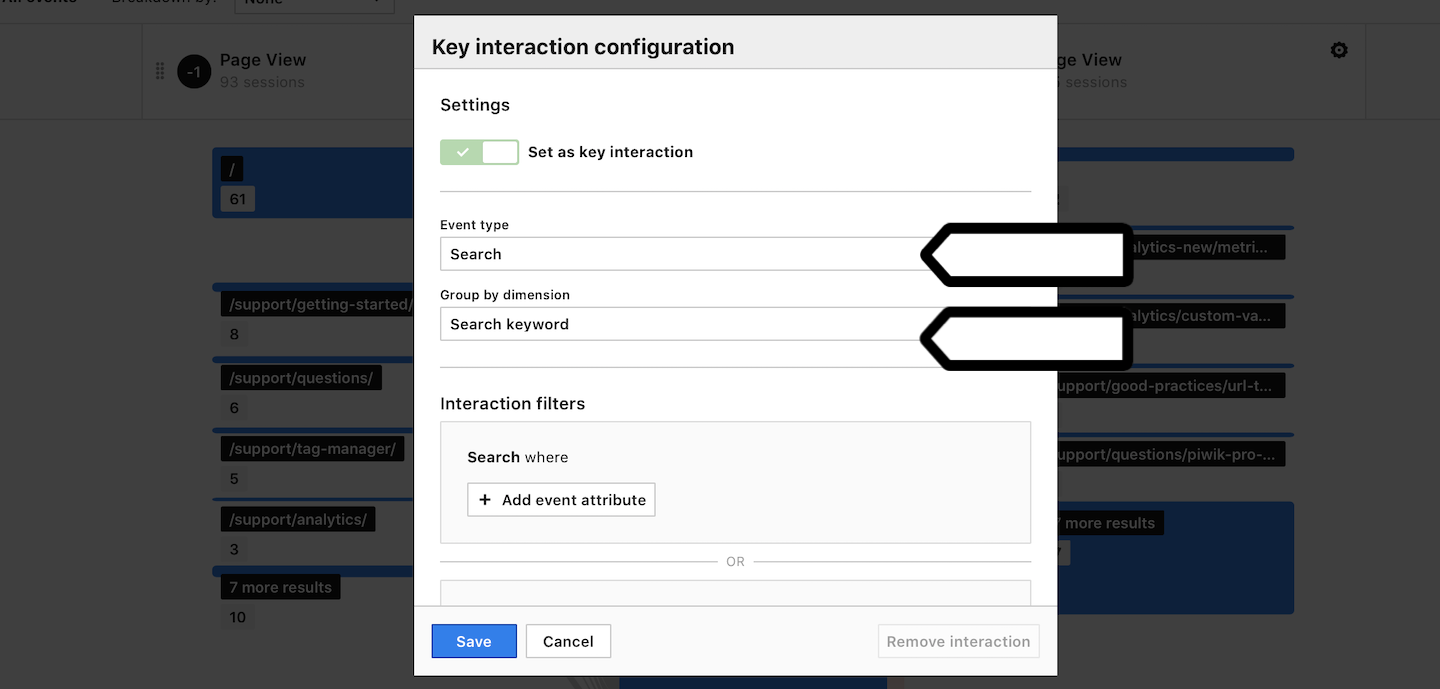
7. Click the ⚙ setting icon next to the key interaction.
8. Set up conditions for the key interaction. In our case, we’ll set the following conditions Event type is search and Group by dimension: search keyword.
9. On the left and right, click + to add previous and next interactions.
10. (Optional) Set up conditions for the previous and next interactions. In our case, we’ll set the previous interaction to all events and the next interaction to page views.
11. (Optional) Toggle Non-strict mode.
12. (Optional) Break down your report by dimensions. In our case, we don’t need to do that.
13. All finished! The report is now ready for use. And let’s look at our example:
- -1 interaction: 174 search events happened on /clearbank/help/
- Key interaction: 221 search keywords have been used but no keyword dominated
- +1 interaction: 125 sessions continued to other pages after the search
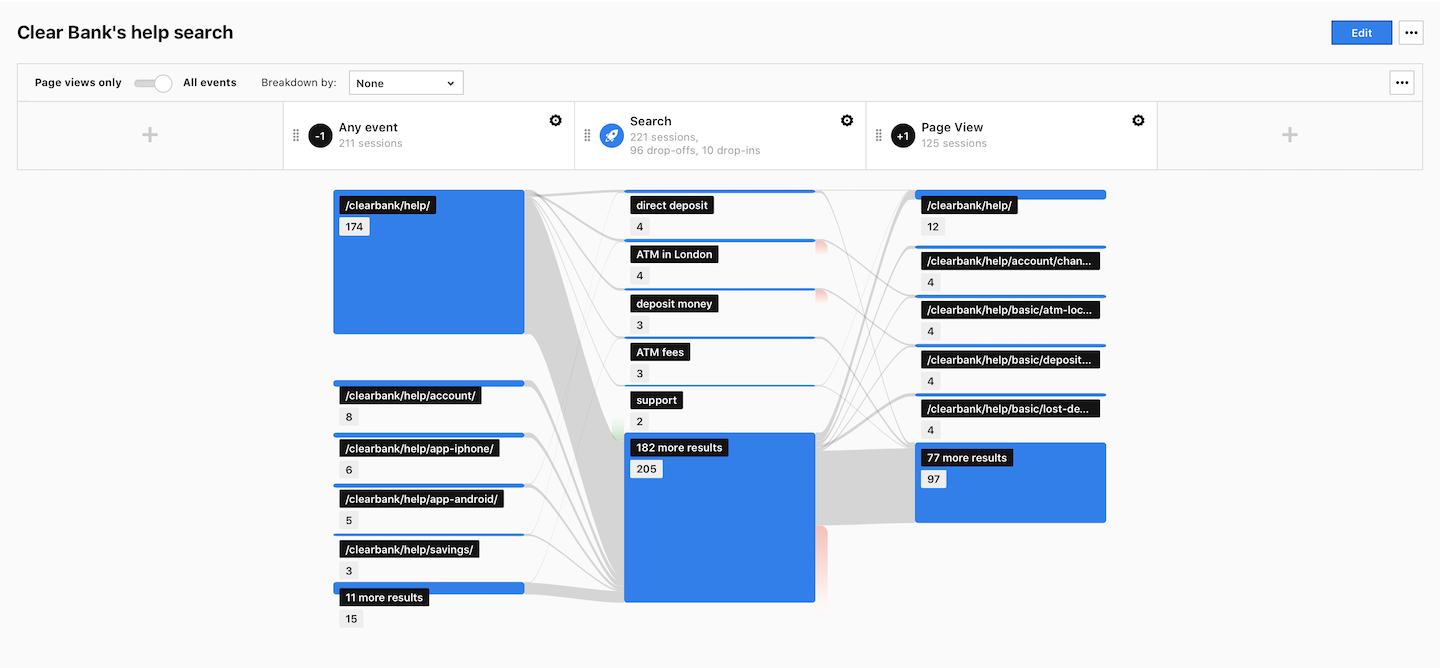
Tip: If the previous interaction has a lower number than the key interaction, it may be due to being filtered to page views. To see all events in the previous interaction, set the event type to all events.
14. Click Highlight top path to see the most used path.
Set up a reversed user flow report
As we explore the user journey at our Clear Bank demo website, it’s essential to understand the routes people take to reach the signup page. A reversed user flow report can help us uncover these routes and find the most effective one.
To set up a reversed user flow report, follow these steps:
1. Go to Menu > Analytics.
2. Navigate to Custom reports.
3. Click Add a report.
4. Select the following report type: User flow.
5. Name the report.
6. In Visibility, choose: Author or All users. All users lets you share this dashboard with your teammates.
7. Click the ⚙ setting icon next to the key interaction.
8. Set up conditions for the key interaction. Example: Page URL is https://clearbank.com/sign-up/.
9. On the left, click + to add previous interactions.
10. (Optional) Set up conditions for the previous interactions. In our case, we’ll leave interactions as page views because we only want to see pages leading to the signup page.
11. (Optional) Toggle Non-strict mode.
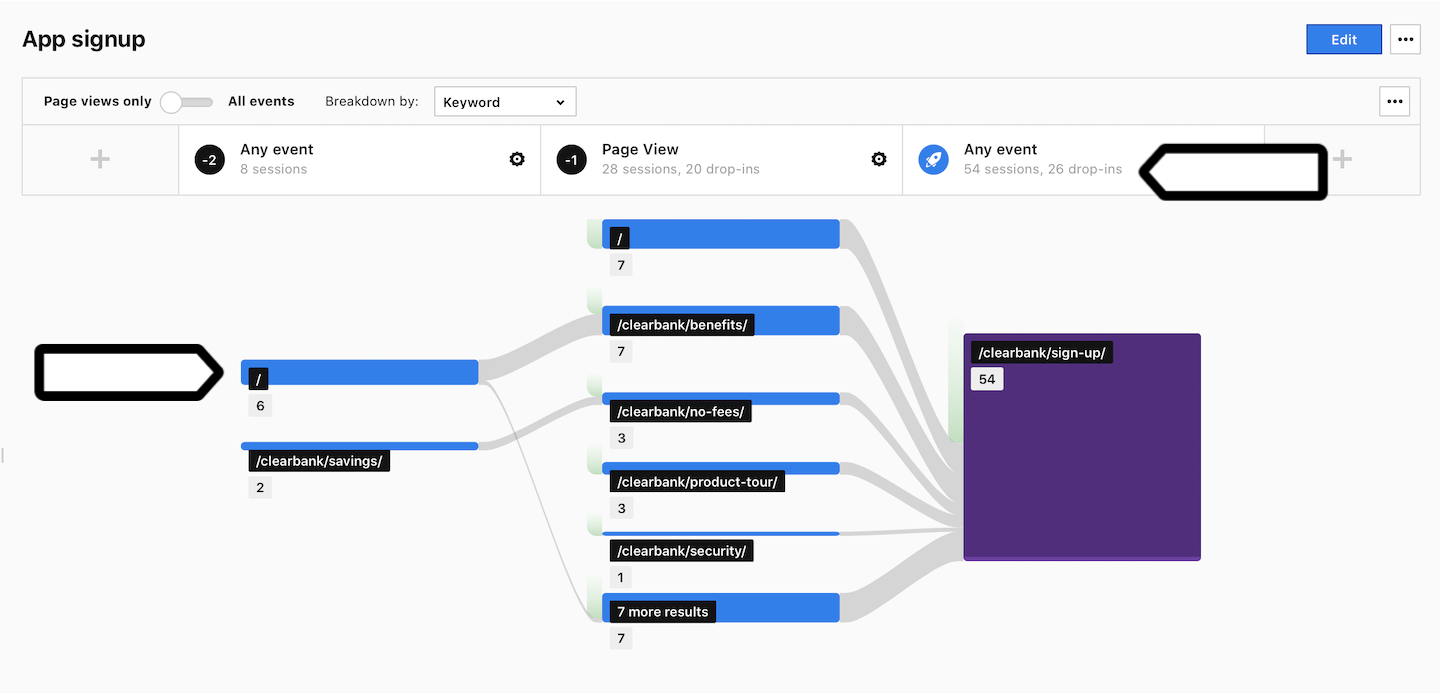
12. (Optional) Break down your report by dimensions. Example: Breakdown by channel.
13. Hover over the key event to see the breakdown details.
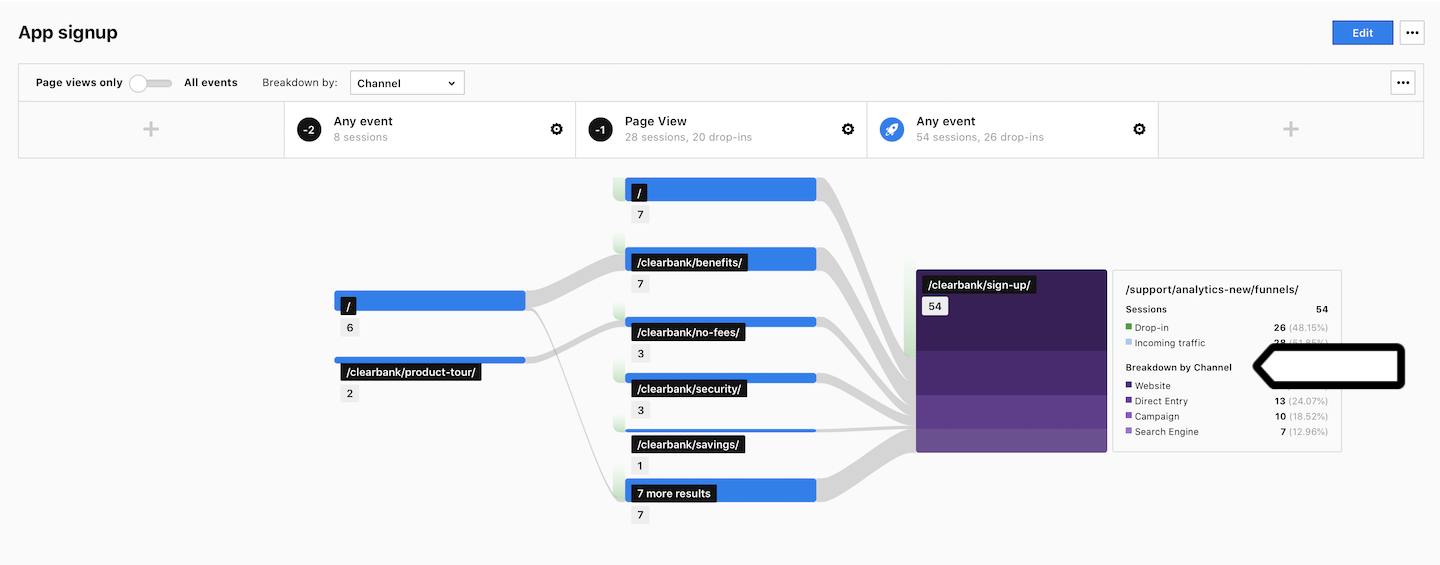
14. Voila! Your report is now all set. So let’s look at our example:
- -2 interaction: 8 sessions have been recorded
- -1 interaction: 20 sessions dropped in
- Key interaction: 26 sessions dropped in
- Top path:
/–>/clearbank/benefits/–>/clearbank/sign-up/and/–>/clearbank/sign-up/
Tip: To add filters to a user flow report, go to Edit > Flow filters.
15. Click Highlight top path to see the most used path.
You can tweak a user flow report in various ways. We advise you to look at your website’s layout, think about what you want to know and design the report to gather that information. That’ll give you the precious details you need to make your website even better.