Real-time dashboards visualize the latest data available. These kinds of dashboards are the most useful if you analyze time-sensitive data and want to be up-to-date with the latest changes.
Before you start
Here are a few helpful things to know before you start:
1. Real-time dashboards show data from the past 5 to 60 minutes.
2. Typically, data is refreshed automatically every 10 to 30 seconds, but large loads of data may cause some slowdowns.
3. Real-time dashboards use the server time recorded when an event reaches Piwik PRO. The lookback window determines how far back the dashboard shows events. In real-time dashboards, the available lookback windows are based on the plan tier. Business plans support up to 30 minutes, while Enterprise plans support up to 2, 12, or 24 hours, depending on the selected tier.
4. Data from web-log analytics won’t appear on real-time dashboards.
5. If mobile app data is delayed longer than the chosen lookback window, it won’t appear on real-time dashboards.
6. This feature is not yet supported on meta sites.
7. There may be some differences between real-time dashboards and other reports because reports contain data that is calculated and cleaned up after the session ends.
8. Some dimensions are not available in real-time dashboards. If at least one dimension is used in a segment, custom channel grouping or calculated metric, it can’t be applied to the real-time dashboard.
9. Real-time data is also available using the API. There are two endpoints available:
- Raw data API – get events in near real-time
- Query API – get reports in near real-time
- Available columns – check which columns are available for real-time dashboards
Turn on real-time dashboards
Real-time dashboards aren’t visible by default. You need to turn them on to view your data in real-time.
To turn on real-time dashboards, follow these steps:
1. Go to Menu > Administration.
2. Select the site you want to work with.
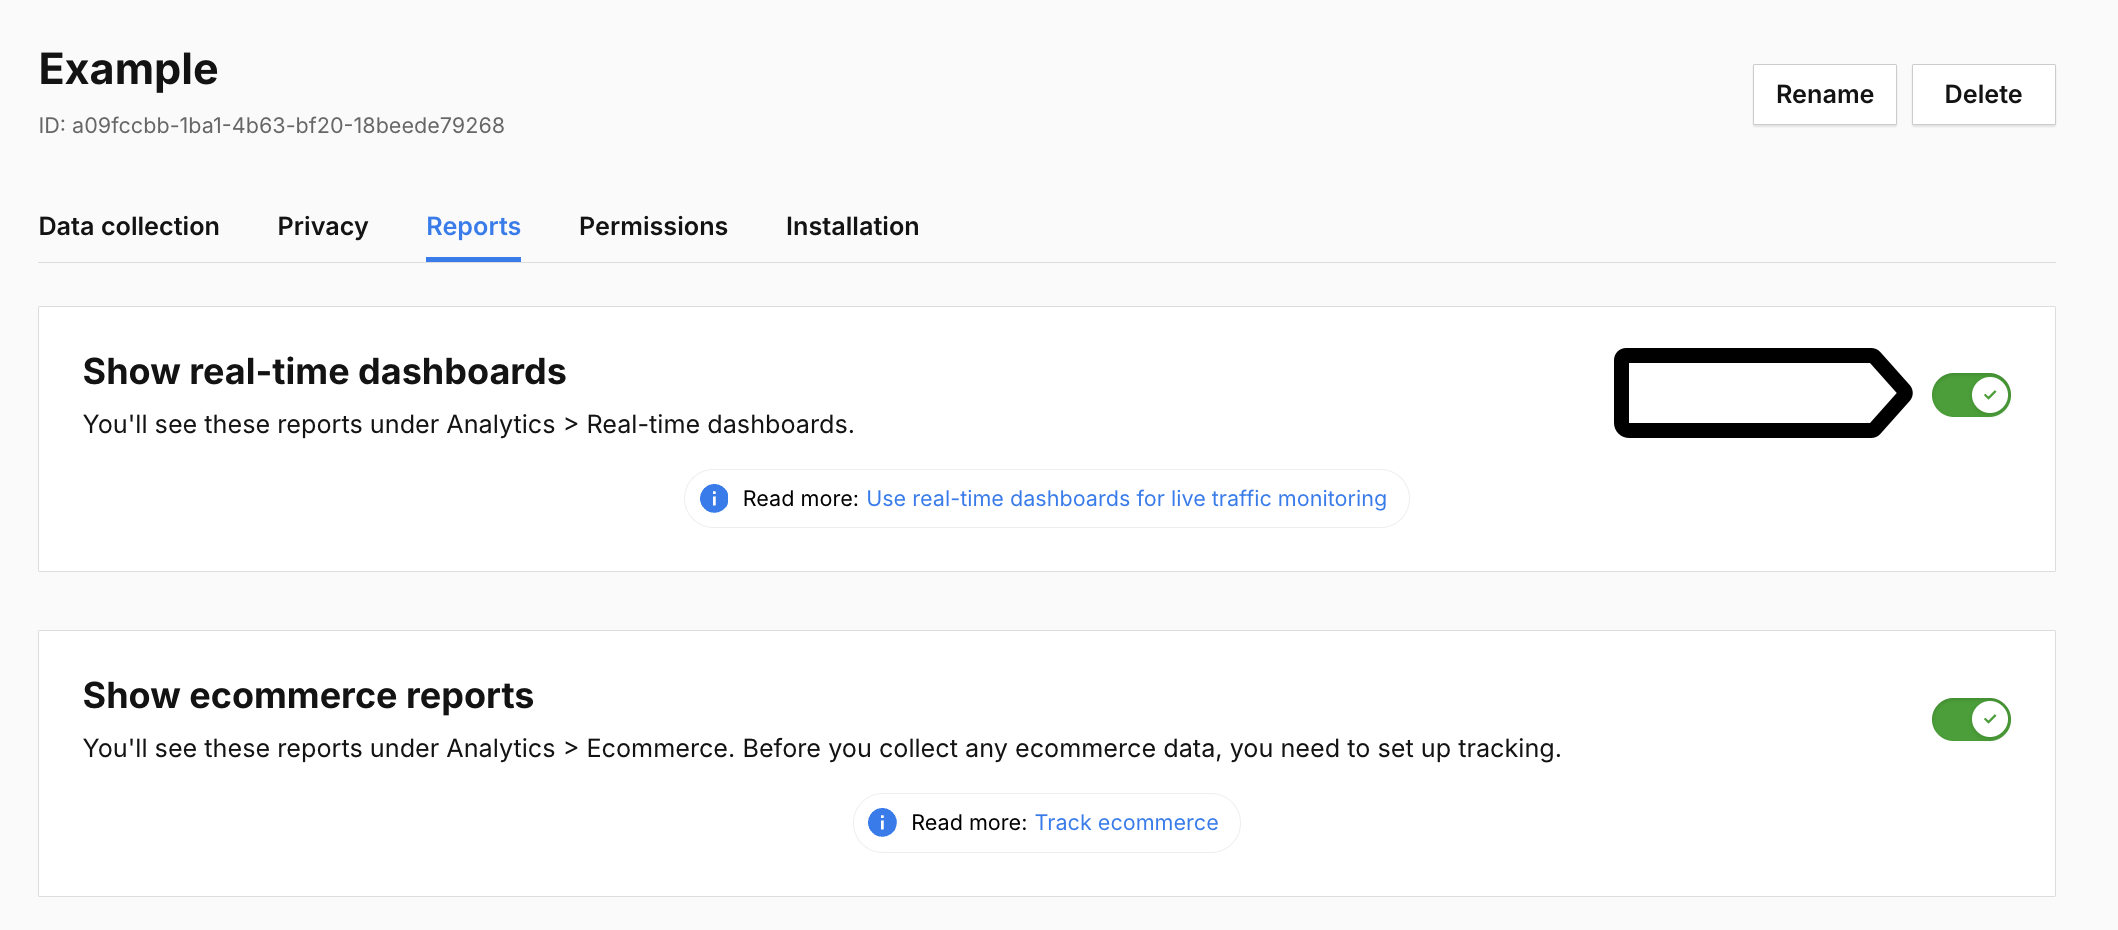
3. Navigate to Reports.
4. Turn on Show real-time dashboards.
Tip: You can use folders to organize your dashboards, custom reports, and goals.
Dashboards and custom reports can be saved in either private or shared folders, no setup needed.
Goals, however, can only be organized into folders in shared locations.
5. All done! Now you’ll see a dedicated section in Menu > Analytics > Real-time dashboards. This is where you’ll find dashboards presenting your real-time traffic.
Create a real-time dashboard
To build a real-time dashboard, follow these steps:
1. Go to Menu > Analytics.
2. Navigate to Real-time dashboards.
3. On the left, click + Add a real-time dashboard.
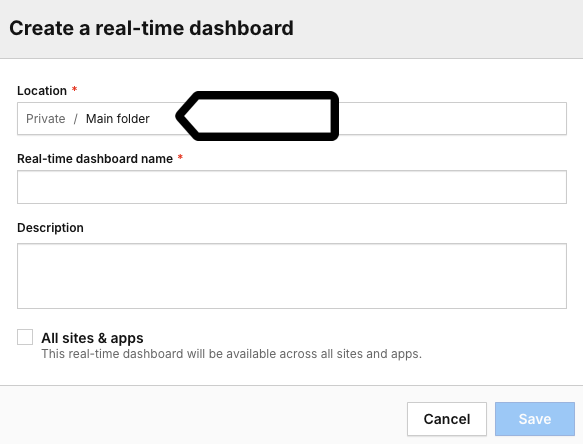
4. In Location, choose whether to create the dashboard in a private or shared location.
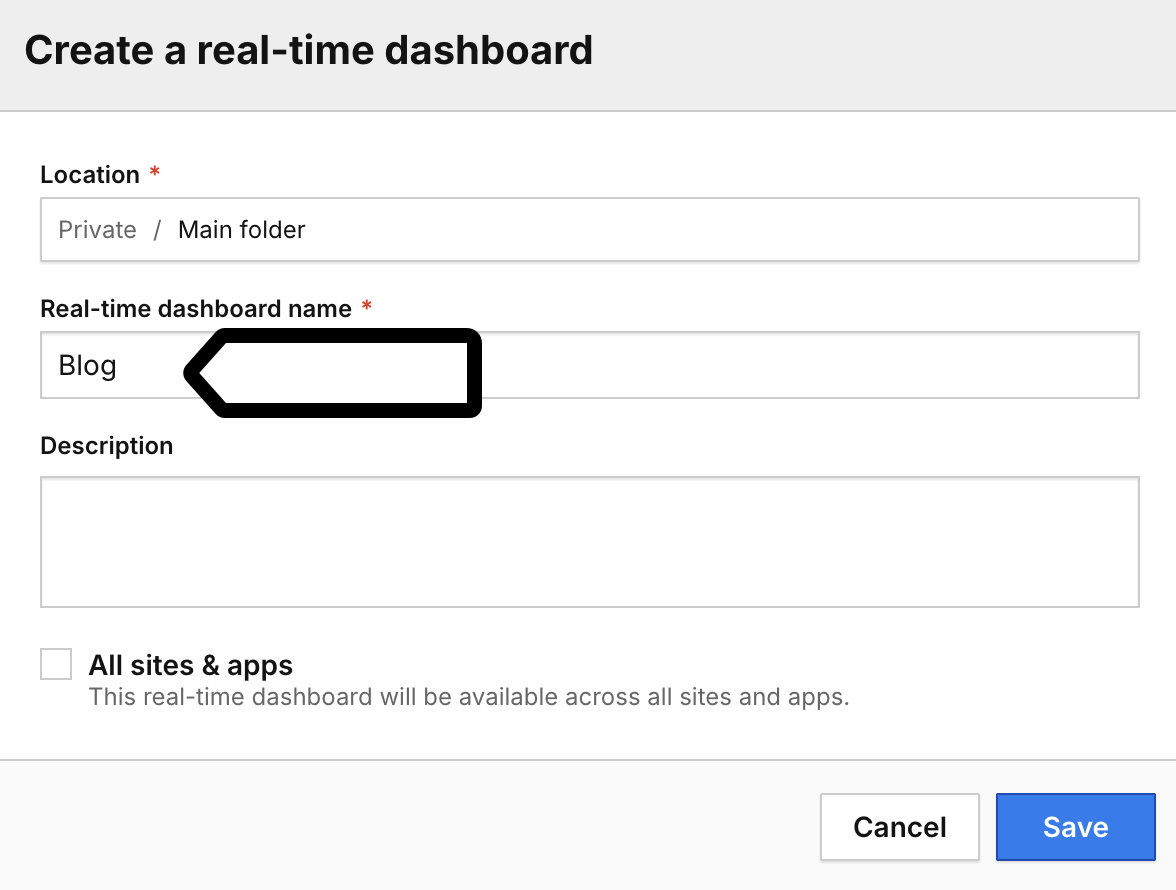
5. Name your real-time dashboard.
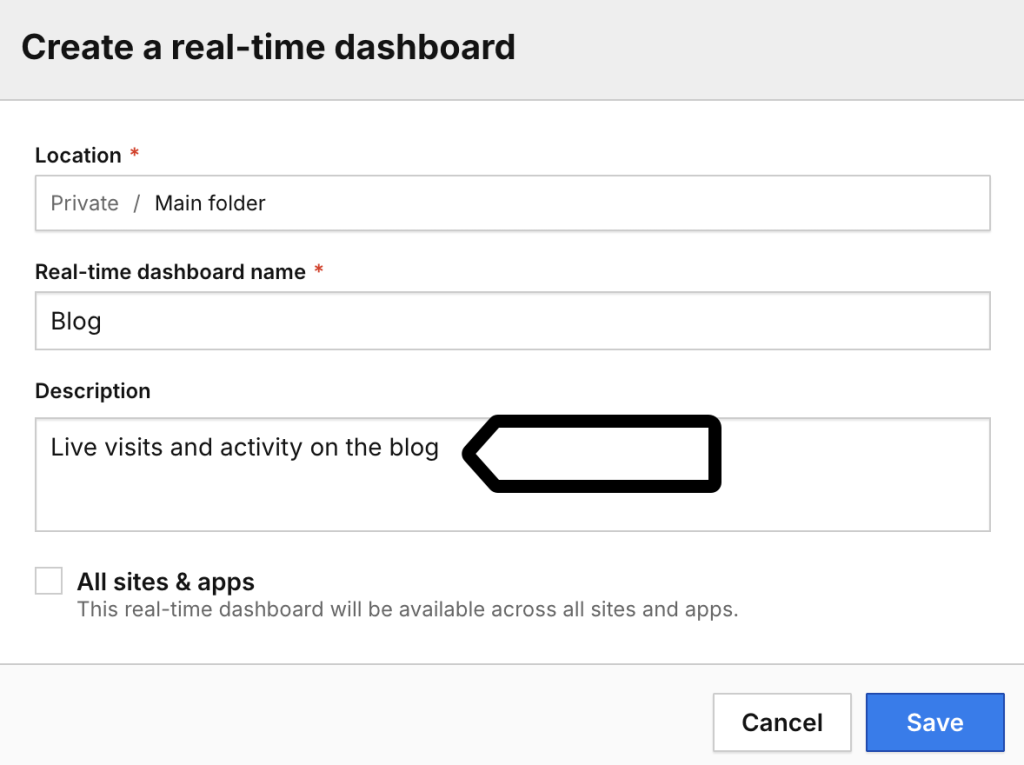
6. (Optional) Add a dashboard description.
7. (Optional) Select All sites & apps to make the dashboard available across all your sites and apps.
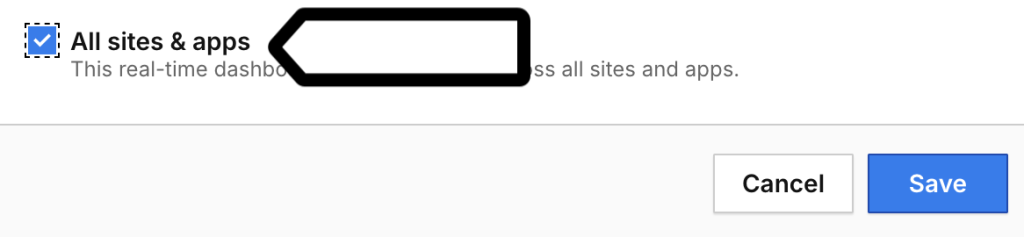
8. Click Save.
9. (Optional) Select the lookback window.
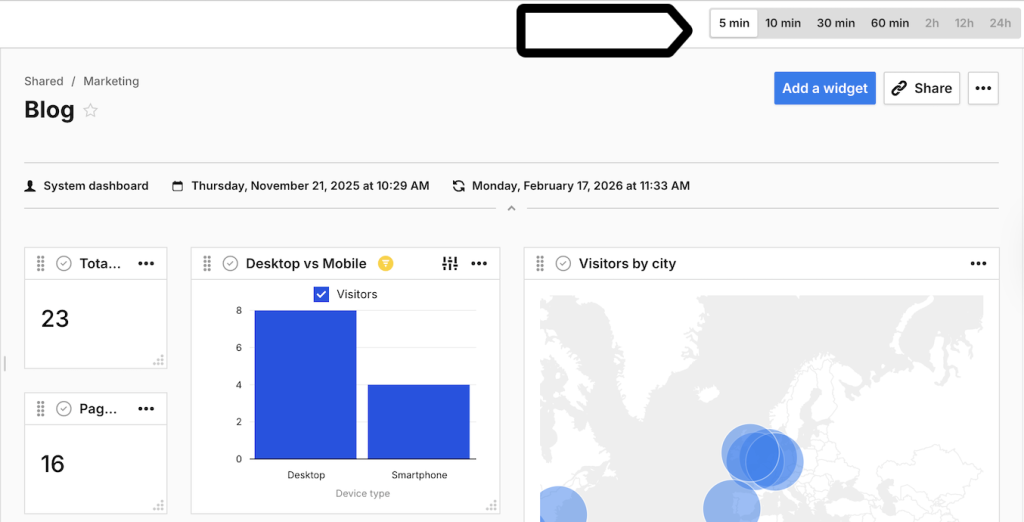
Note: Real-time dashboards use the server time recorded when an event reaches Piwik PRO. The lookback window determines how far back the dashboard displays events.
Available lookback windows depend on your plan:
- Business: Up to 30 minutes.
- Enterprise: Up to 2, 12, or 24 hours, depending on your plan tier.
By default, the lookback window is 5 minutes.
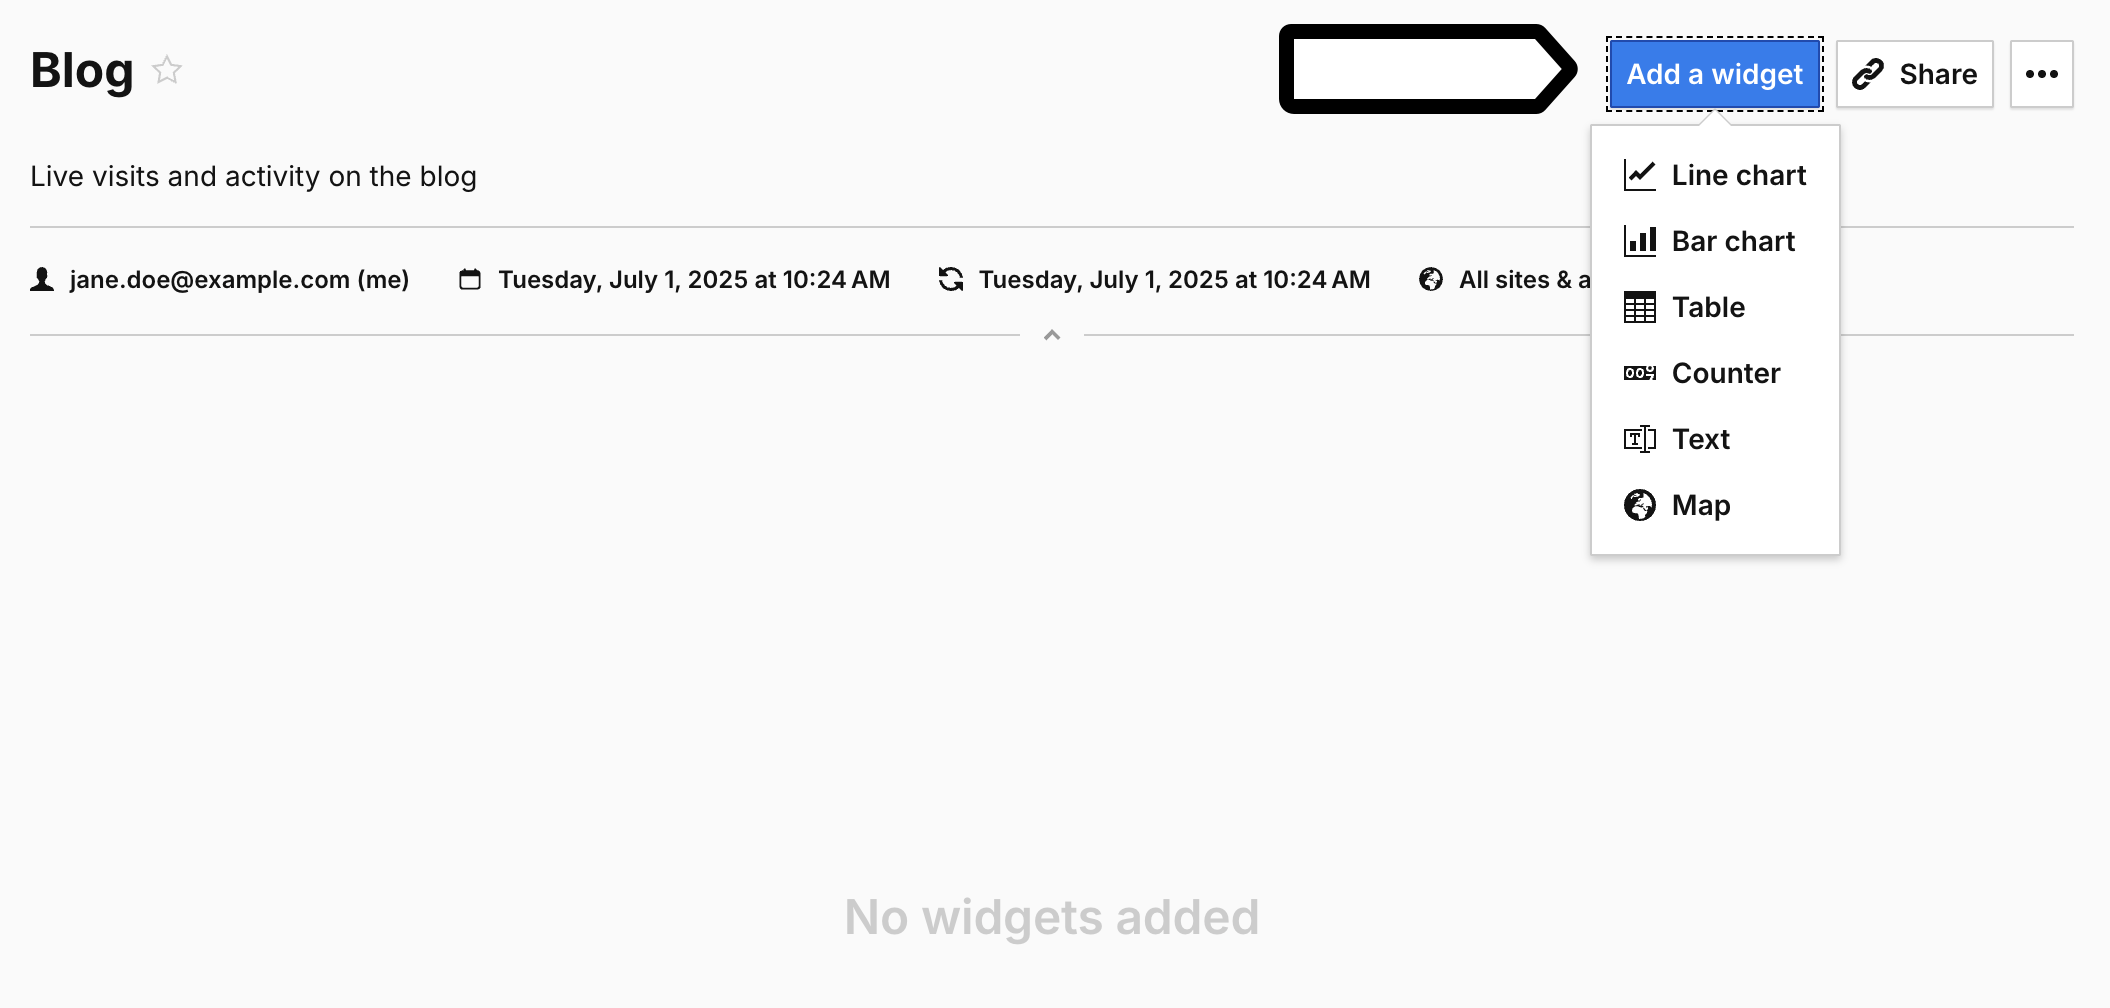
10. On the right, click Add a widget and choose the one you want to add to your real-time dashboard.
11. Name the widget.
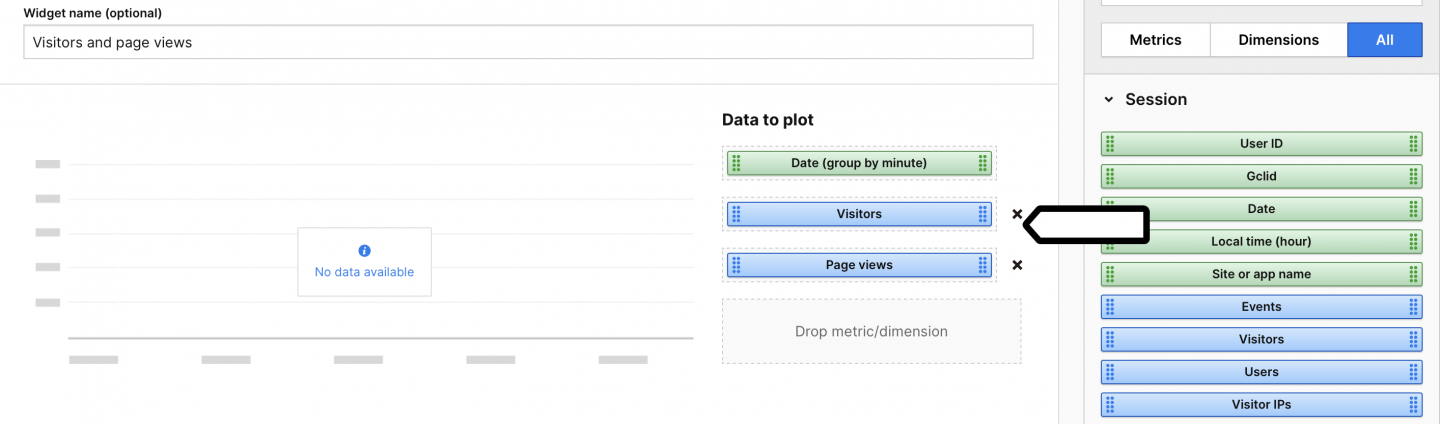
12. On the right, select the data you want to see on the dashboard. Depending on the type of widget, you can either select metrics or a combination of metrics and dimensions.
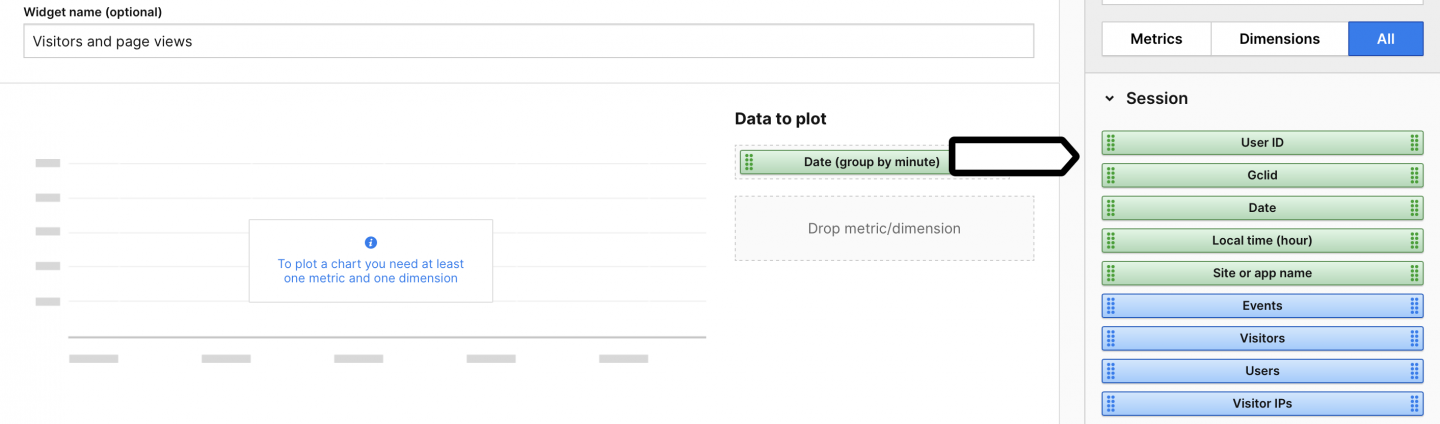
13. Drag and drop the data into the designing space.
Note: For a flat table widget, you can set default sorting options. This makes the data appear in the report in a specific order based on the selected dimension or metric.
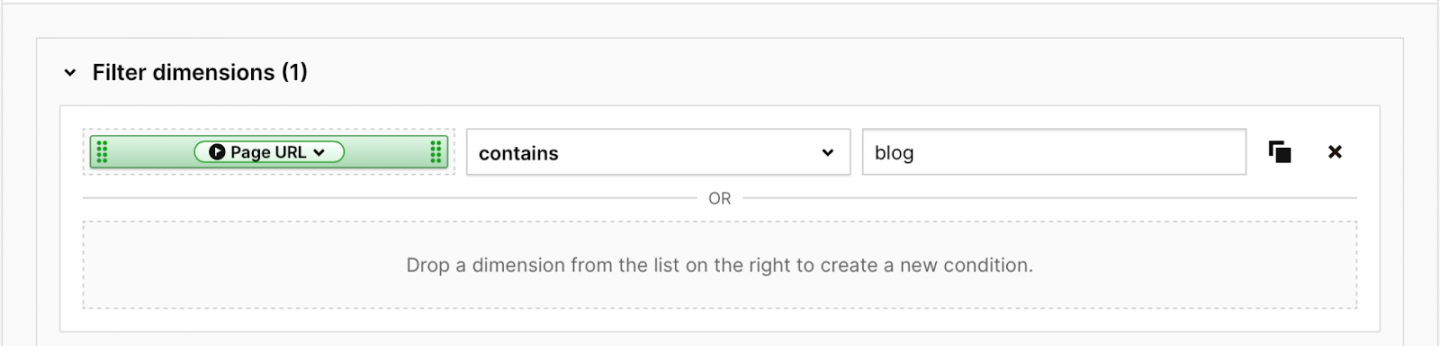
14. (Optional) Apply filters to dimensions or metrics. For example, if we only want to see data from our blog, we can apply the following filter: Page URL contains blog.
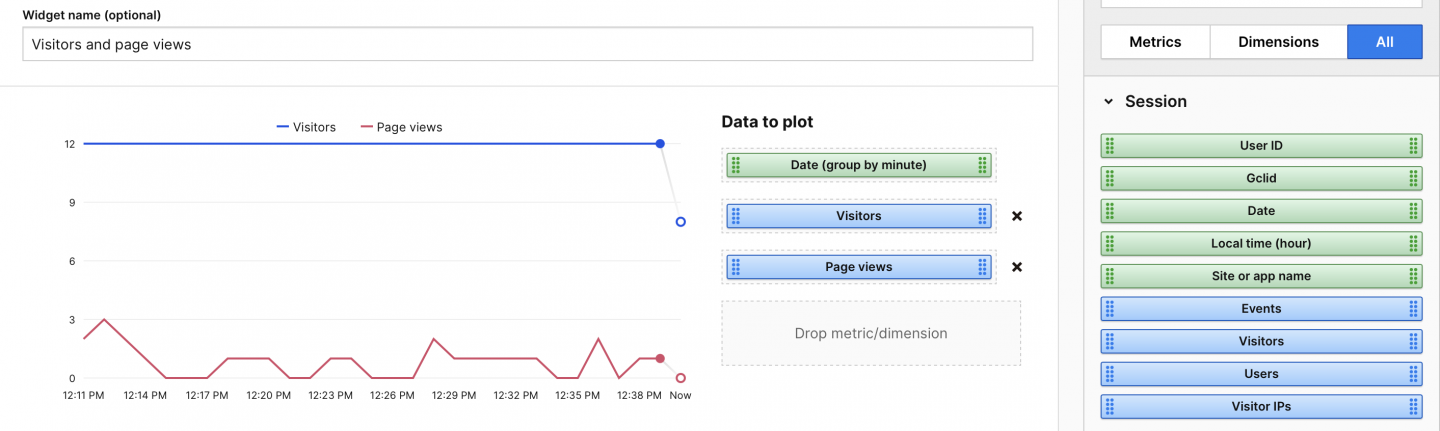
15. The preview will refresh automatically.
16. When you’re happy with the widget, click Save.
17. Create and add other widgets.
18. When done, drag and drop widgets into the desired positions on your dashboard.
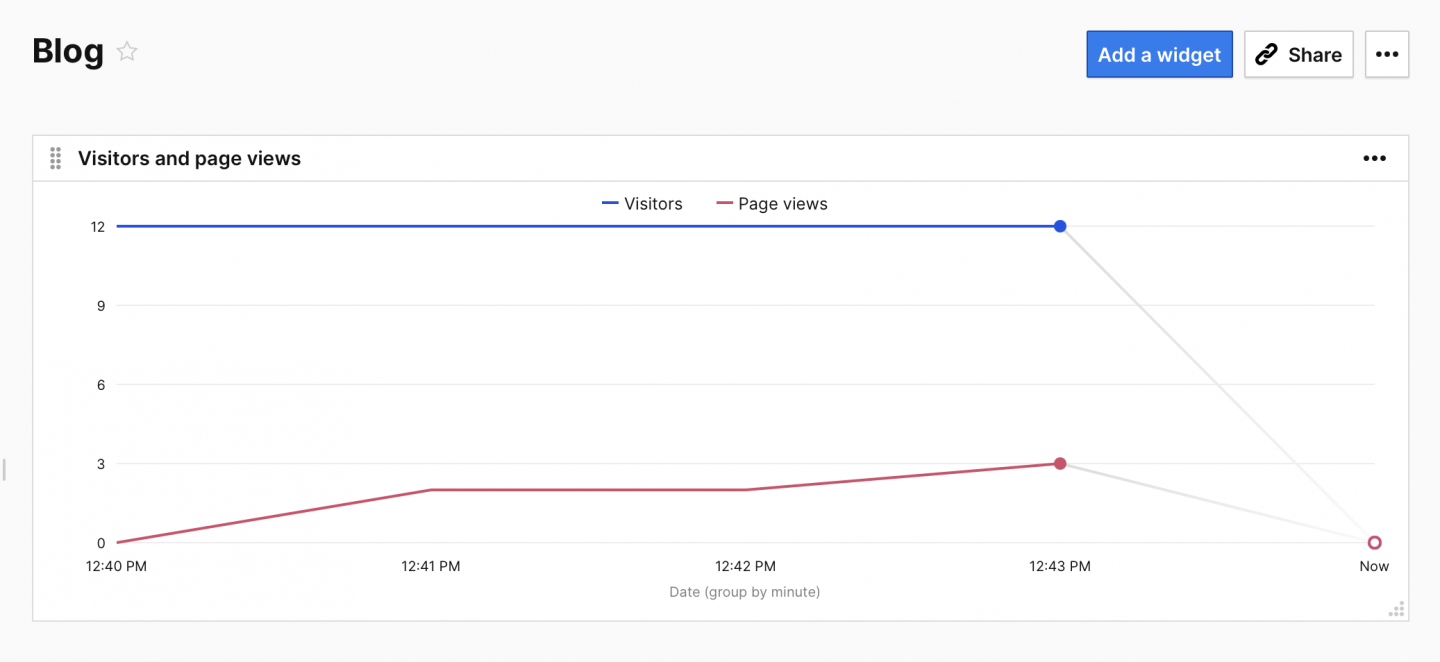
19. Task completed! Your real-time dashboard is ready.
Tip: You can send your teammates a link to your real-time dashboard by simply clicking on Share in the upper right corner. But note that you need to make the shared dashboard visible to “All users” – not just you – and these users need to have access to your site or app.
Turn on or off presentation mode
You can use presentation mode to view real-time dashboards in full screen. This is particularly useful when you want to have your dashboard constantly displayed on another screen or TV.
The presentation mode also solves the problem of being logged out after 30 minutes of inactivity. It displays real-time data for up to 12 hours or until you close the tab.
For security reasons, you automatically get logged out when you start presentation mode but the mode keeps displaying real-time data without interruptions.
To turn on or off presentation mode, follow these steps:
1. Go to Menu > Analytics.
2. Navigate to Real-time dashboards.
3. Choose your real-time dashboard from the list.
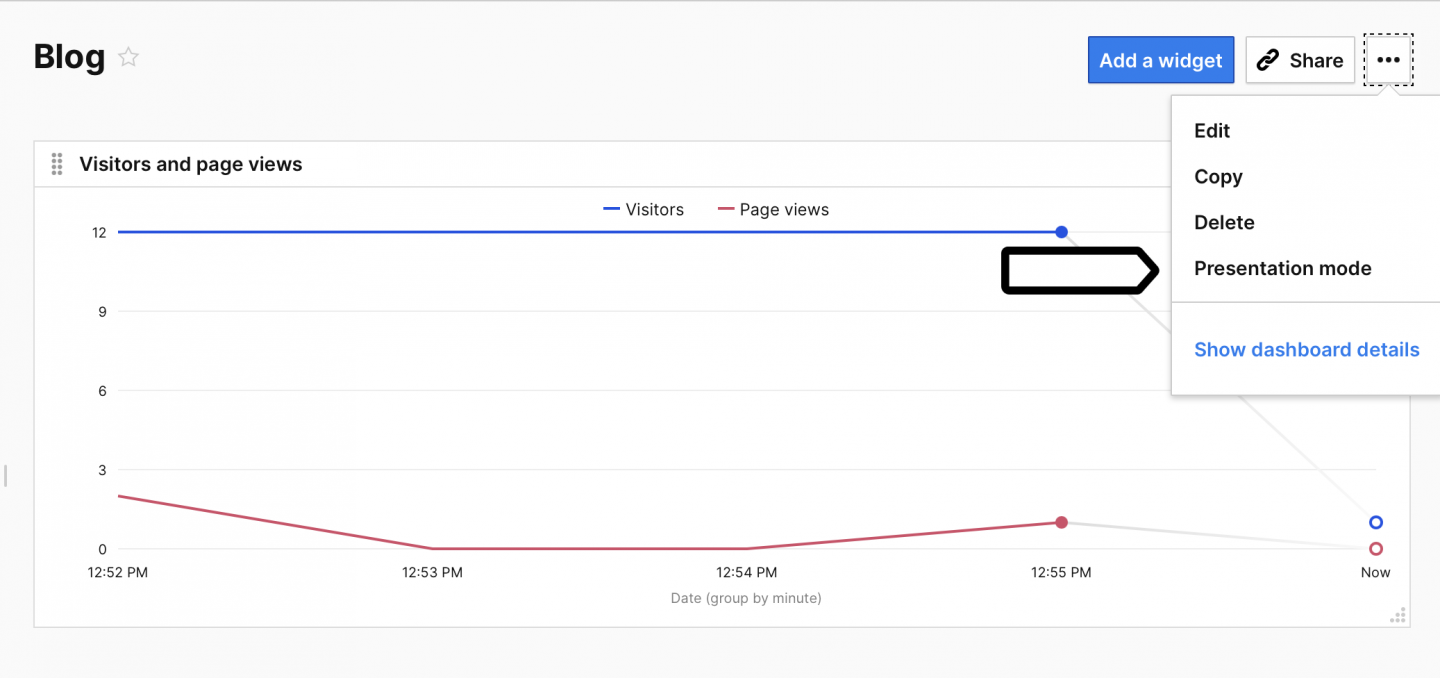
4. On the left, click the ⋯ three-dot icon.
5. Click on Presentation mode.
6. Confirm by clicking Switch.
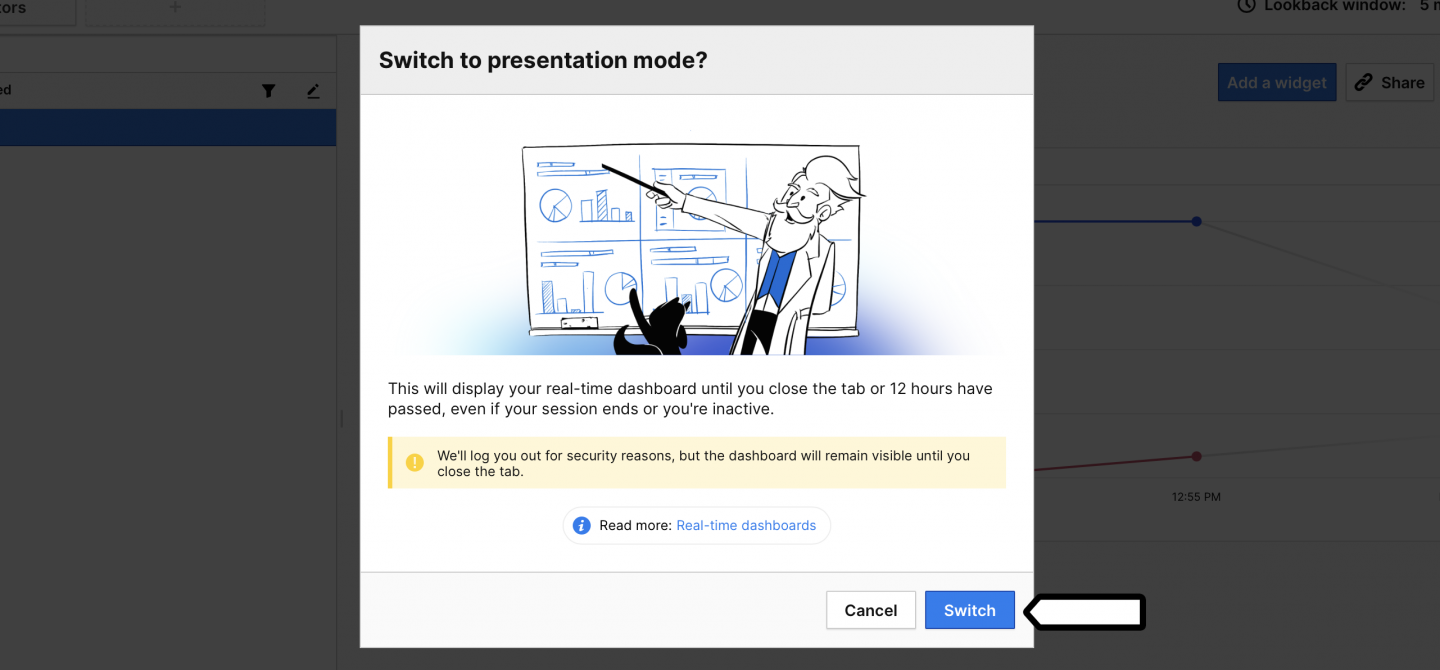
Note: We’ll log you out as soon as you confirm that you want to turn on the presentation mode, but the real-time dashboard will be constantly visible on your screen or TV.
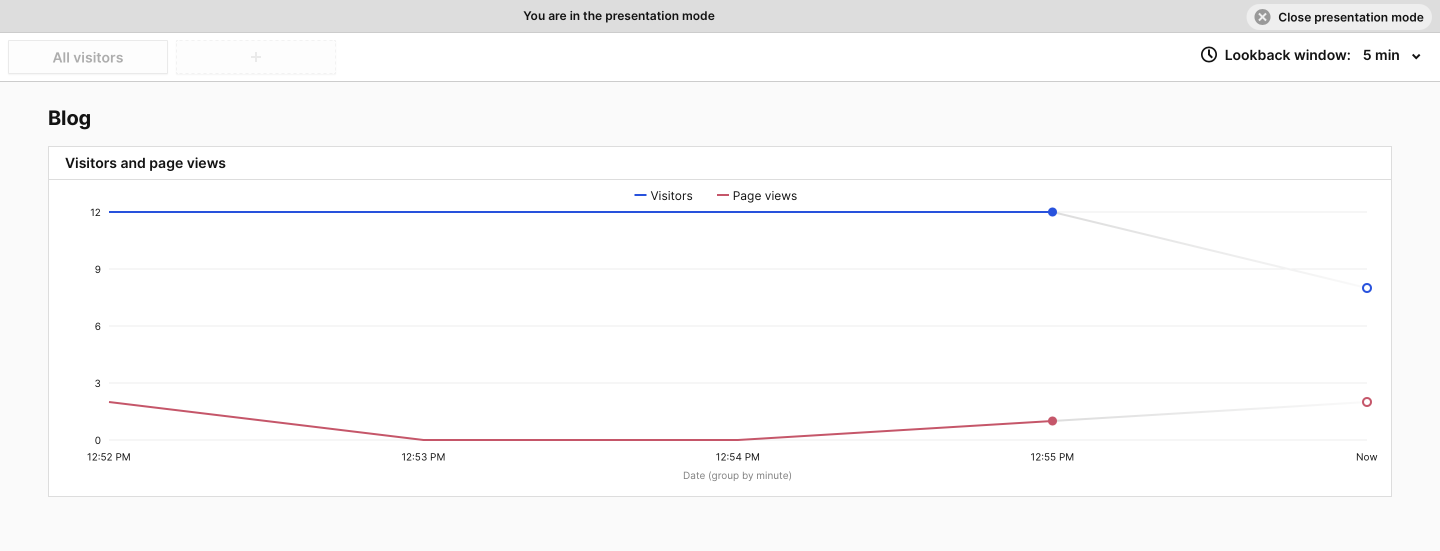
7. Now your presentation mode is turned on, and you can see the real-time data without interruptions.
8. If you want to turn off the presentation mode, just close the tab or click on Close presentation mode in the upper right corner.
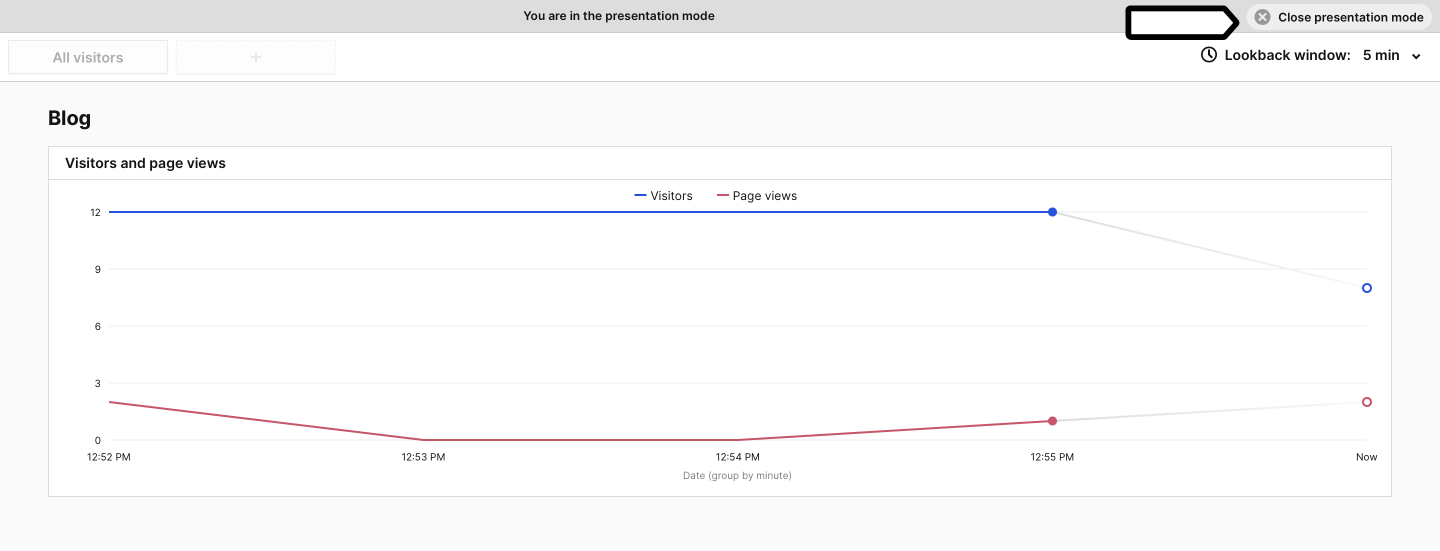
Note: If you turn off the presentation mode, you’ll be redirected to the login page.
9. Great! Now you know how to turn on and off the presentation mode.
Unsupported dimensions and metrics
Not all dimensions and metrics are available for real-time dashboards. Reports are based on open sessions, so dimensions and metrics that are calculated after the session ends aren’t available.
Dimensions
Here is a full list of dimensions that aren’t available for real-time dashboards.
| Dimension name | Category | Scope |
|---|---|---|
| Returning visitor | User | Session |
| Next page view title | Event | Event |
| Next page view URL | Event | Event |
| Previous page view title | Event | Event |
| Previous page view URL | Event | Event |
| Search category | Event | Event |
| Time on page | Event | Event |
| Adds to cart in session | Ecommerce | Product |
| Orders in session | Ecommerce | Session |
| Product detail views in session | Ecommerce | Product |
| Removes from cart in session | Ecommerce | Product |
| Shopping stage | Ecommerce | Session |
| Events in session | Session | Session |
| Session time | Session | Session |
| Page views in session | Session | Session |
| Outlinks in session | Session | Session |
| Downloads in session | Session | Session |
| Site searches in session | Session | Session |
| Custom events in session | Session | Session |
| Content impressions in session | Session | Session |
| Content interactions in session | Session | Session |
| Goal conversions in session | Session | Session |
| Abandoned carts in session | Session | Session |
| Bounced session | Session | Session |
| Session entry title | Session | Session |
| Session entry URL | Session | Session |
| Session exit title | Session | Session |
| Session exit URL | Session | Session |
| Session goals | Session | Session |
| Session second title | Session | Session |
| Session second URL | Session | Session |
| Unique content impressions in session | Session | Session |
| Unique content interactions in session | Session | Session |
| Unique custom events in session | Session | Session |
| Unique downloads in session | Session | Session |
| Unique outlinks in session | Session | Session |
| Unique page views in session | Session | Session |
| Unique site searches in session | Session | Session |
| Domain lookup time | Website performance | Event |
| Page rendering time | Website performance | Event |
| Server connection time | Website performance | Event |
| Server response time | Website performance | Event |
| Time of redirections | Website performance | Event |
| Time to interact | Website performance | Event |
| Time until DOM is ready | Website performance | Event |
| Session custom dimensions | Custom dimensions | Session |
| Session custom variable key | Custom variables | Session |
| Session custom variable value | Custom variables | Session |
Metrics
Here is a full list of metrics that aren’t available for real-time dashboards.
| Metric name | Category |
|---|---|
| Sessions | Session |
| Bounces | Session |
| Bounce rate | Session |
| Page bounce rate | Session |
| Exits | Session |
| Exit rate | Session |
| Entries | Session |
| Entry rate | Session |