Before publishing a tracking setup, you can check if everything works as expected using our debug mode. Debug mode loads your website with unpublished changes and lets you test how tags, triggers, and variables function.
Before you start
Here are a few things to know before you start:
1. In February 2025 we updated our debug mode. Now, you can access it in Tag Manager > Debug mode. The old version is no longer available.
Note: To avoid problems with connecting your site to debug mode, make sure:
- The installation code on the website you’re connecting to matches the site or app in the site/app picker in the upper right corner.
- Your browser allows popups. Some browsers, such as Safari, block them by default.
- The necessary code is installed on your site.
- Your site address is correct and you’re connecting to the correct URL.
- Ad-blocking extensions are temporarily disabled.
Use the debug mode
To use debug mode, follow these steps:
1. Go to Menu > Tag Manager.
2. Choose the site/app you want to work with. Use the site/app picker in the upper right corner.
3. Go to Debug mode.

4. In Your site address, type in or select your site or app address.
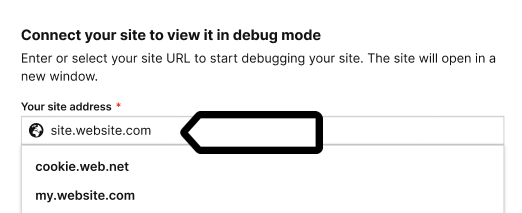
Note: The available sites depend on those you’ve added to your account in
Administration > Sites & apps > Choose your site from the list > Data collection > Site or app address.
5. Click Connect.
6. Once your site is connected, it will open in a new tab.
Note: If you have any trouble connecting, check that:
- The installation code on the website you’re connecting to matches the site or app in the site/app picker in the upper right corner.
- Your browser allows popups. Some browsers, such as Safari, block them by default.
- The necessary code is installed on your site.
- Your site address is correct and you’re connecting to the correct URL.
- Ad-blocking extensions are temporarily disabled.
- A Cross-Origin-Opener-Policy (COOP) header may block the connection in debug mode. Try disabling it temporarily with a browser extension.
7. (Optional) Turn on Prevent page reload. This will stop the page from refreshing when you click elements that would normally trigger a reload.
Tip: This option is useful for testing form submissions and link clicks.
8. On your site or app, perform the action you want to test to check if the tag fires. Example: Scroll 100% of the page.
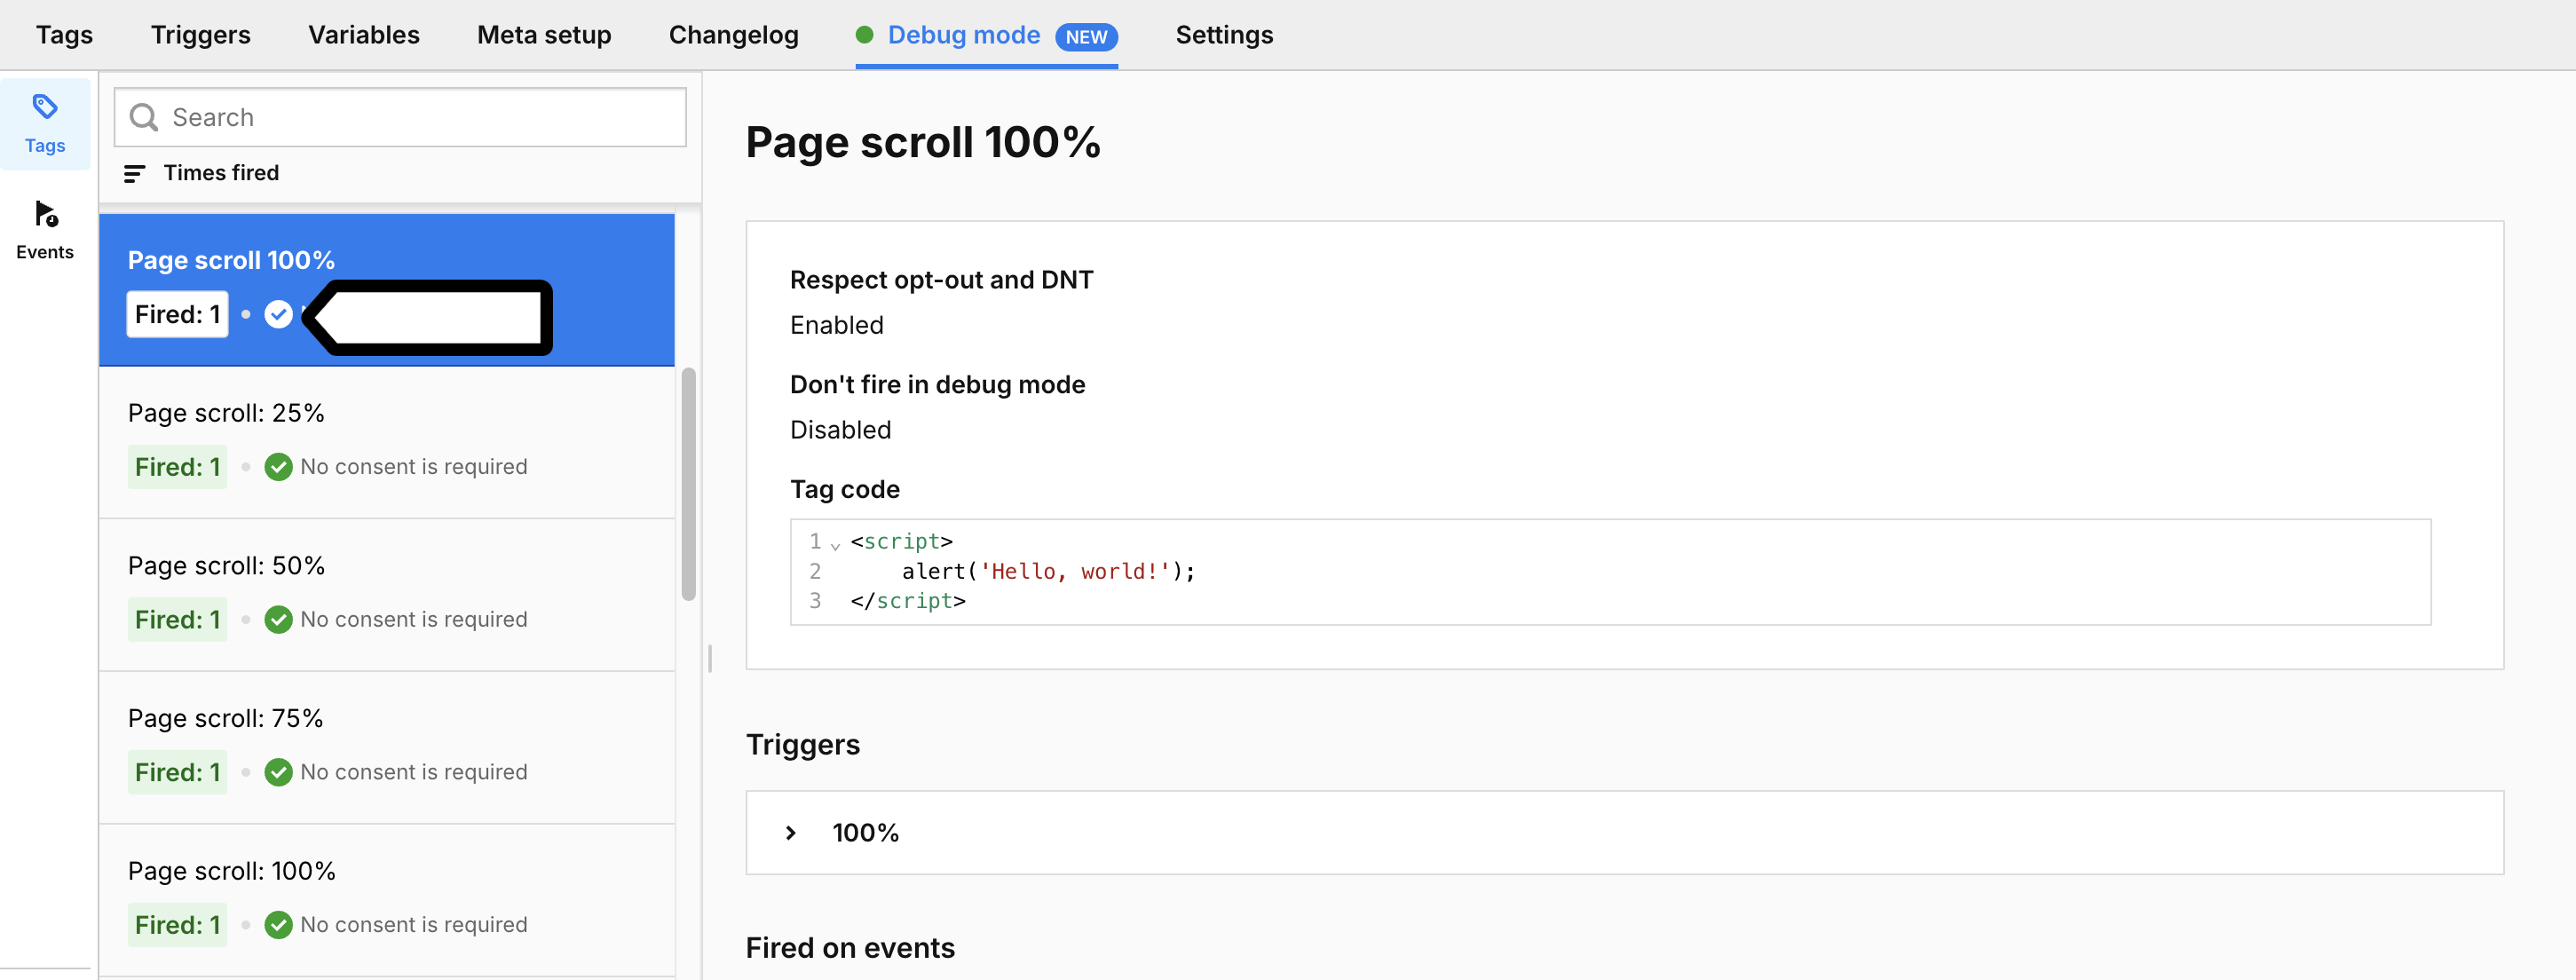
9. To view fired tags and recorded events, return to Tag Manager > Debug mode.
10. In Tags, see all the tags that fired. Example: Page scroll 100%.
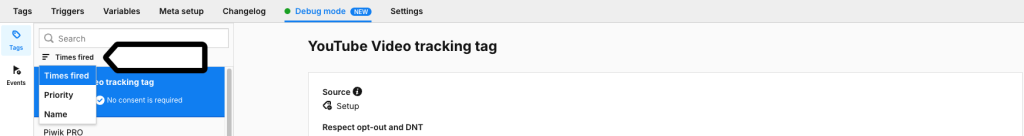
Note:
- You can filter tags in debug mode by times fired, priority, and name:
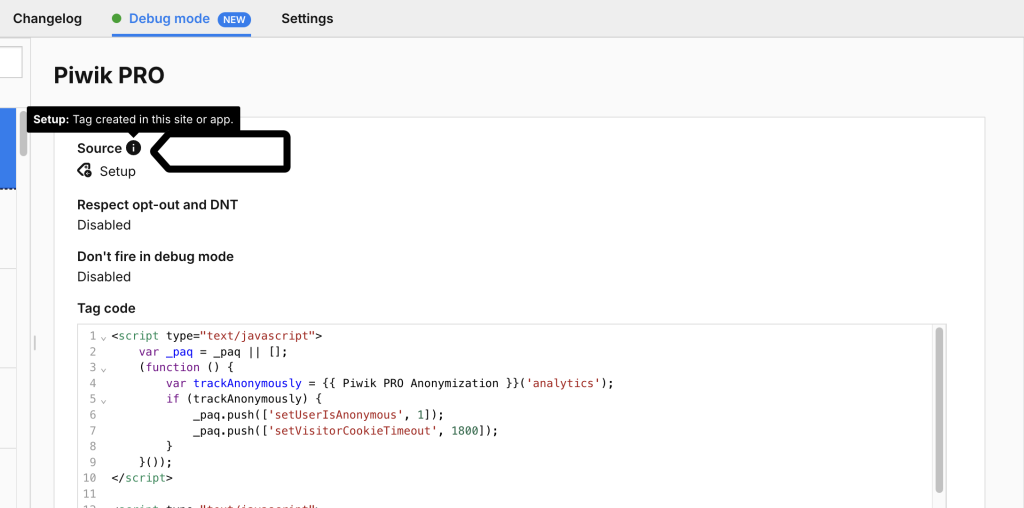
- You can identify where each tag comes from by its icon:
- Setup tag – Added manually by the user.
- Meta setup tag – Created automatically during a meta setup.
- System tag – Created when certain system settings are turned on, like scroll tracking in Administration. This tag is only visible in debug mode.
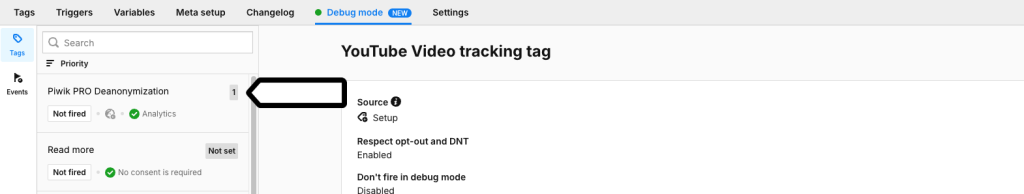
- If you sort tags by priority, the priority number will appear in the left menu:
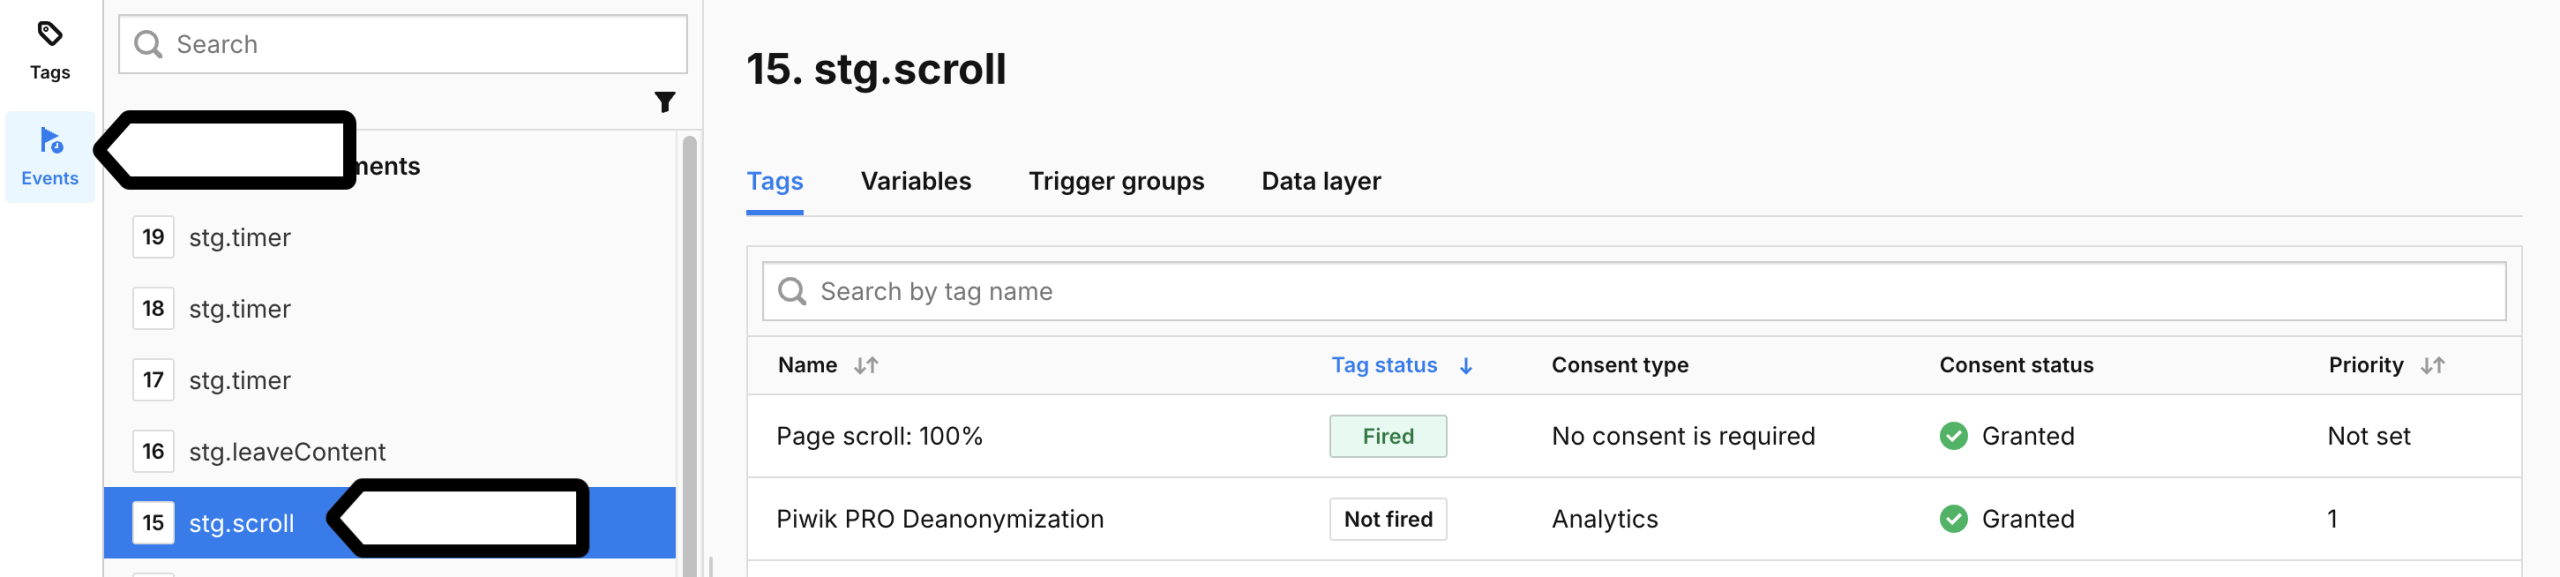
11. In Events, you’ll see which event triggered the tag.
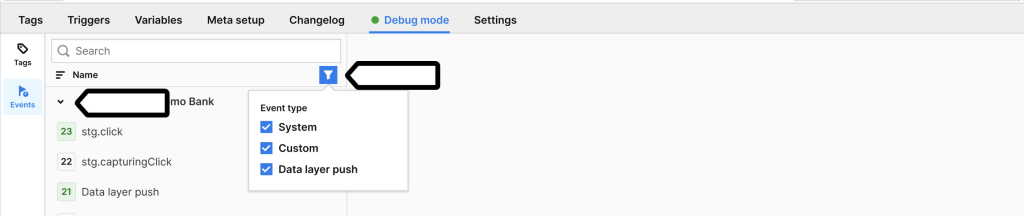
Note: You can filter events in debug mode:
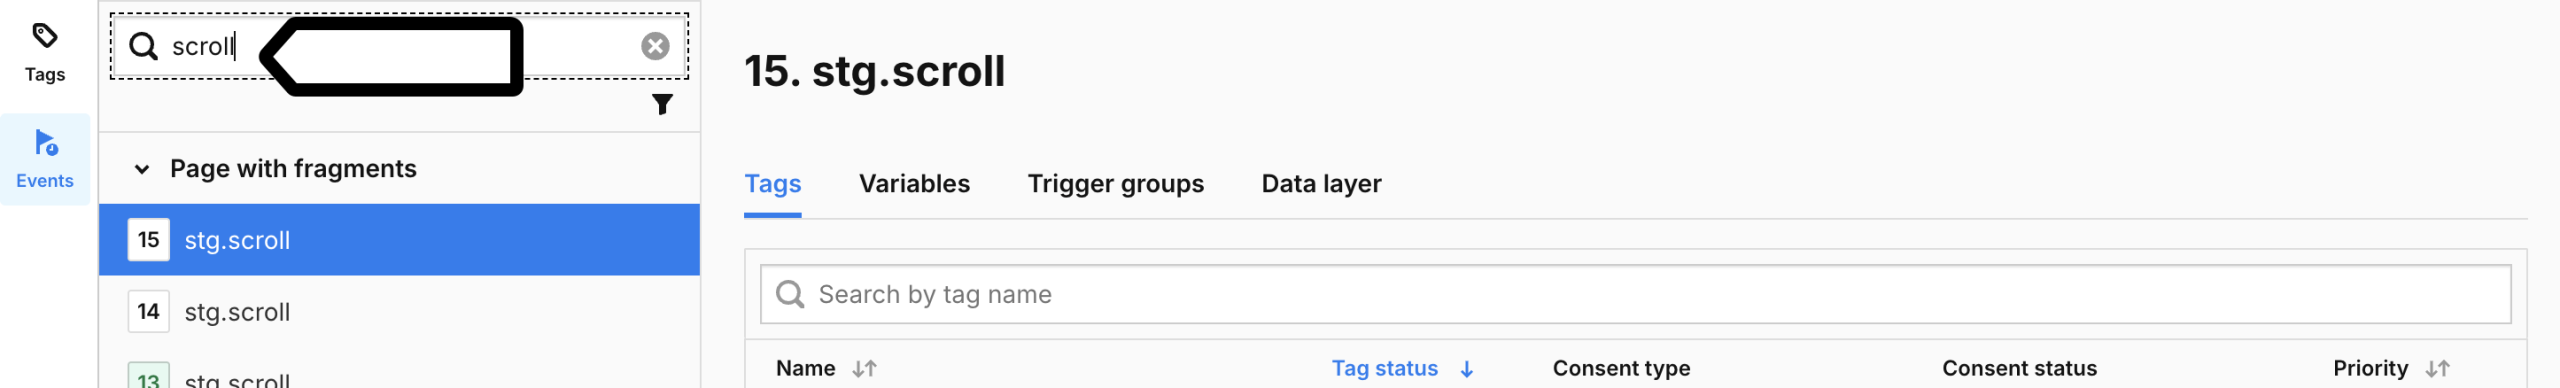
12. You can use the search option to find a specific tag or event.
13. (Optional) You can share debug mode access for the connected site or app.
Note: You can share debug mode access for the connected site or app by sharing a link, even to users who don’t have a Piwik PRO account. Read more in this article.
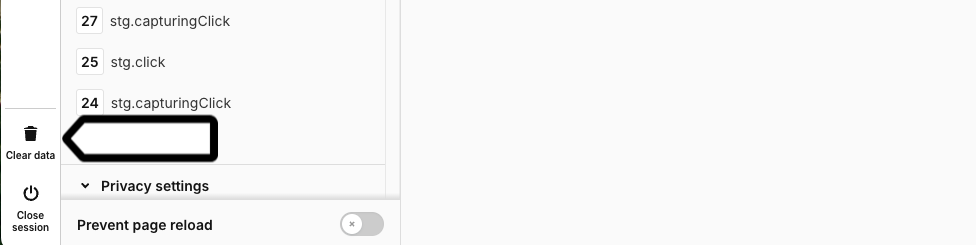
14. (Optional) Click Clear data to reset the event list and start fresh without leaving this debug mode session.
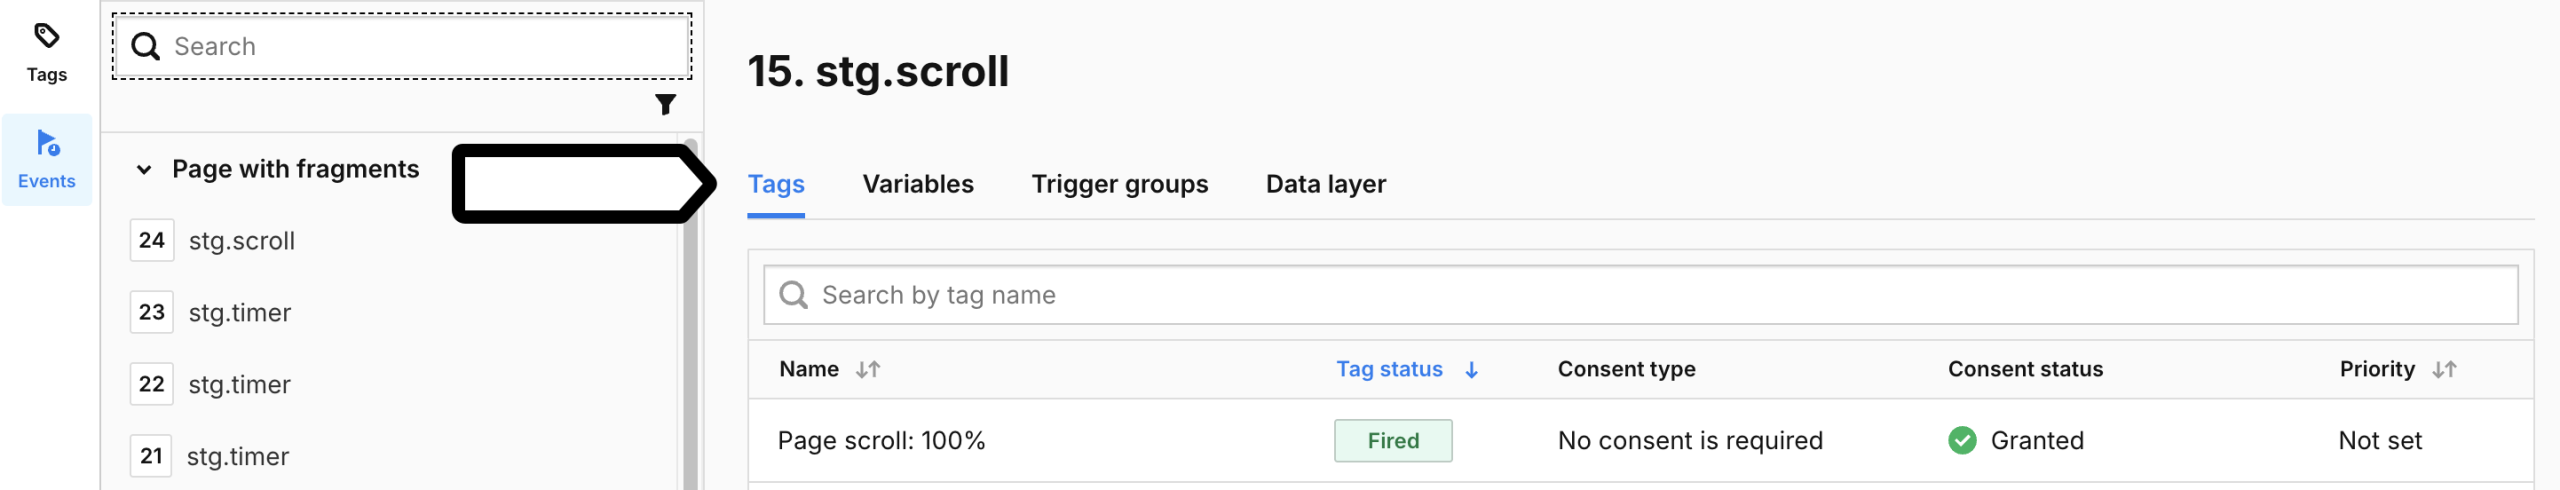
15. To see the tag’s state for a specific event, for example, stg.scroll event, go to Events > stg.scroll and check Tags, Variables, Trigger groups, and Data layer.
Note:
- Changes to your site or app’s tags, triggers, and variables made during the debugging session won’t be visible right away in the debug mode. Restart the debug session to see the changes.
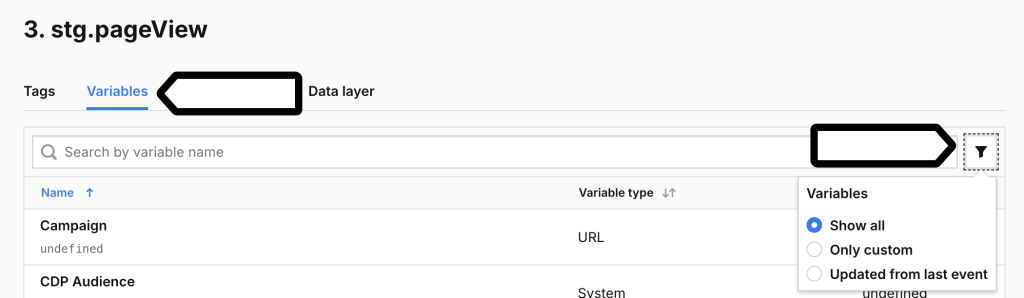
- You can filter variables in debug mode. Go to Events > Variables.
16. When you’re happy with your tracking setup, return to Tag Manager and click Publish.
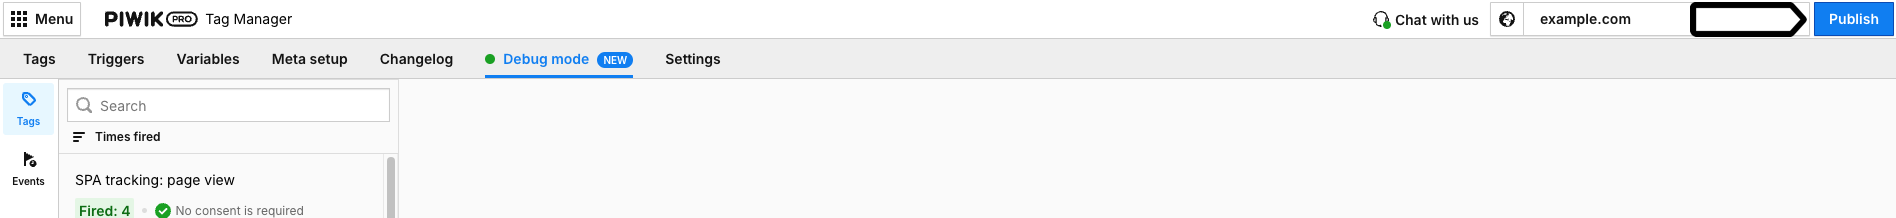
17. Done! Your tracking setup is now live.
Troubleshoot debug mode
Sometimes, debug mode disconnects. Here’s why:
- You closed the session manually – If you click Close session or Disconnect, debug mode stops working.
- Network issues – If your internet connection is lost, the session will disconnect.
- You switched browsers – Debug mode is tied to your active session. If you log in from a different browser, your previous session will be terminated.
- You switched sites or apps – Changing the site or app interrupts the active debug session.
- If debug mode disconnects, start a new session by following the steps above.