Creating your first custom report can be a bit of a challenge when you’re just starting out. That’s why we’ve got you covered! We’ve put together a list of custom report templates to get you started and inspire your reporting journey.
In this article, we’ll show you 12 useful custom reports.
Tip: You can use folders to organize your dashboards, goals, and custom reports. Add shared or private folders directly in the UI, no setup needed.
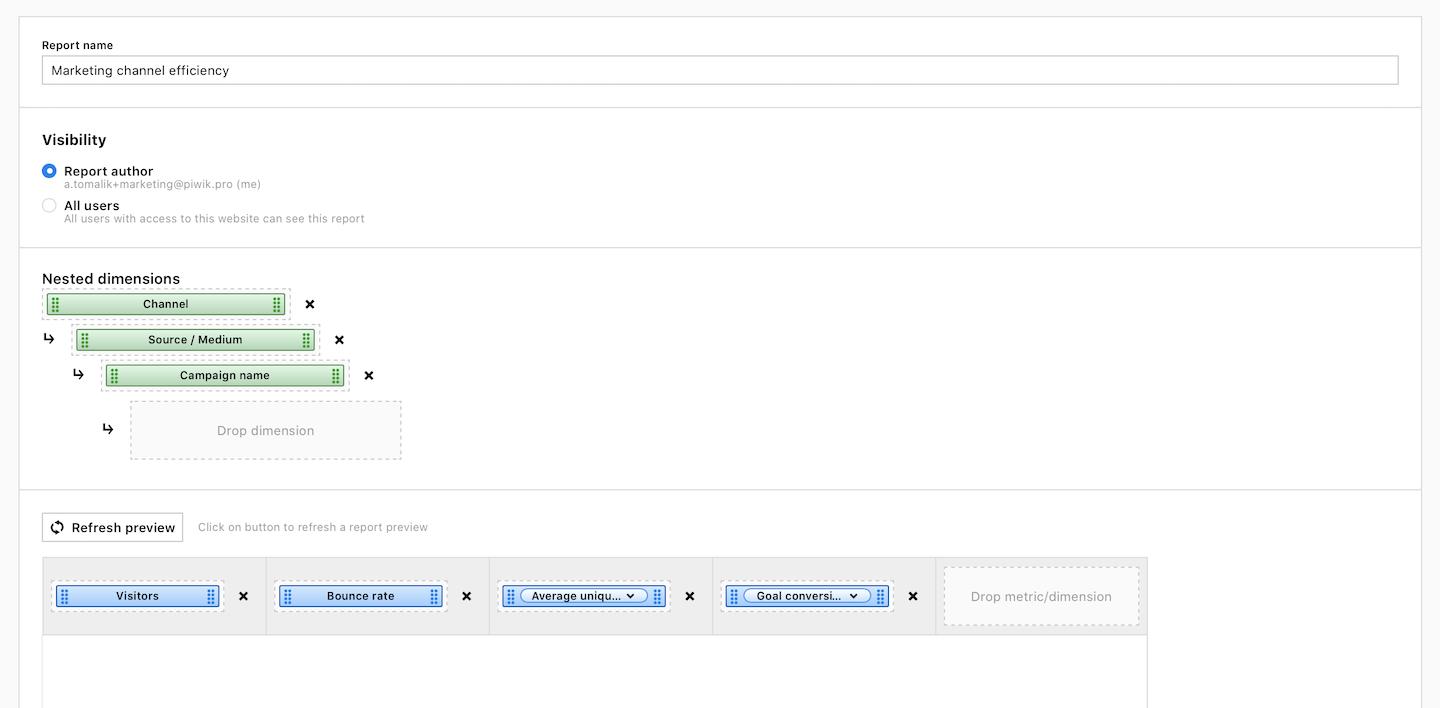
Marketing channel efficiency report
This report highlights the most effective website traffic channels.
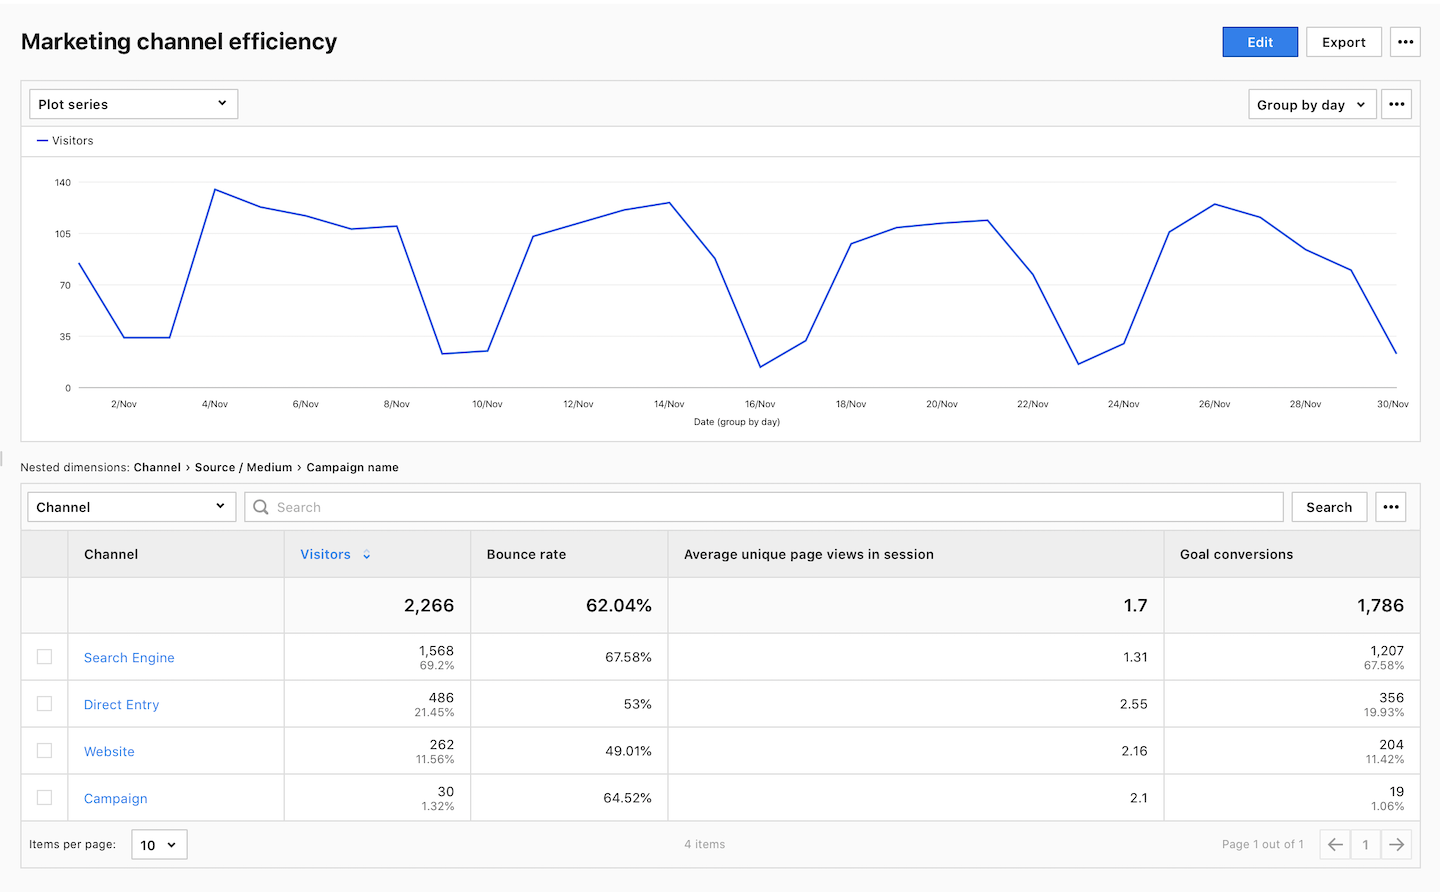
Report setup:
- Report type:
Table - Dimensions:
Channel,Source / mediumandCampaign name - Metrics:
Visitors,Bounce rate,Average unique page views in sessionandGoal conversions
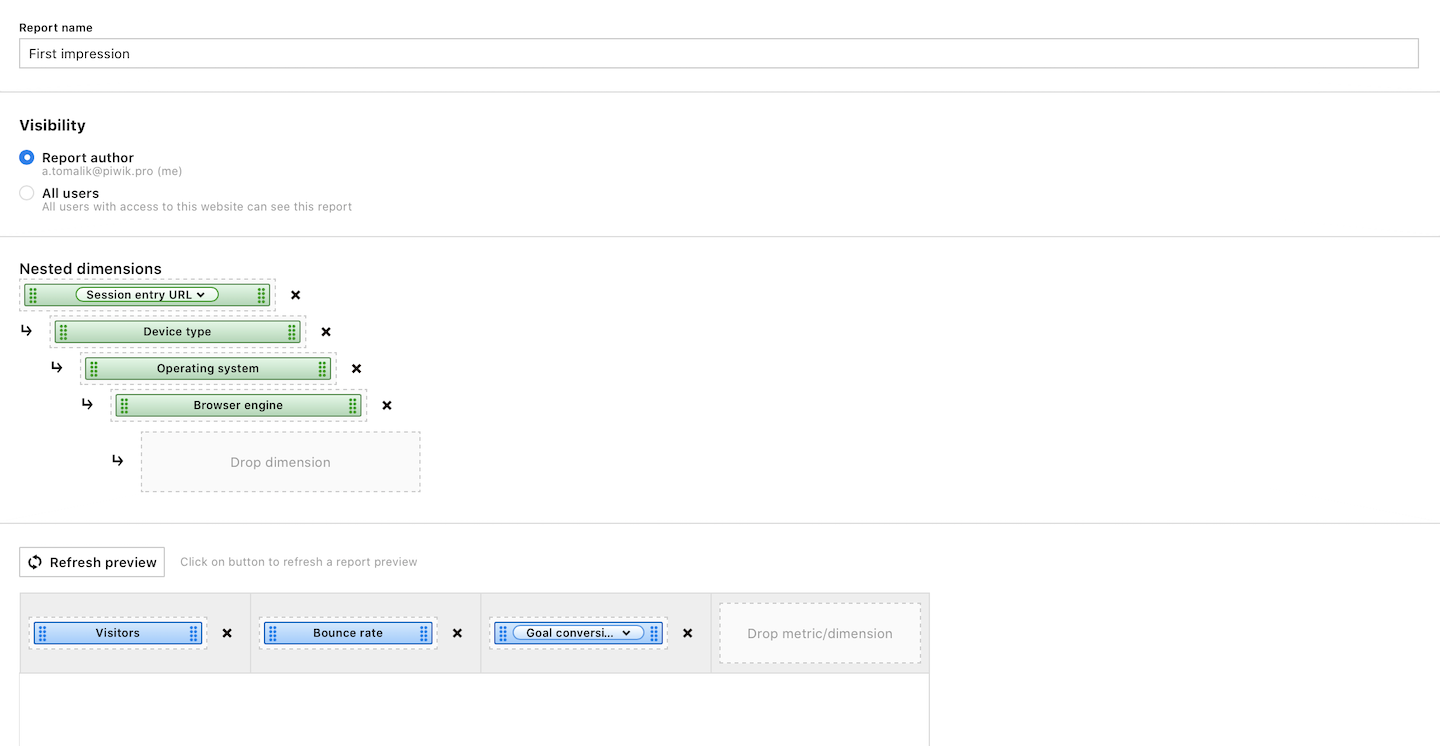
First impression report
This report reveals how well your website engages new visitors on their various devices.
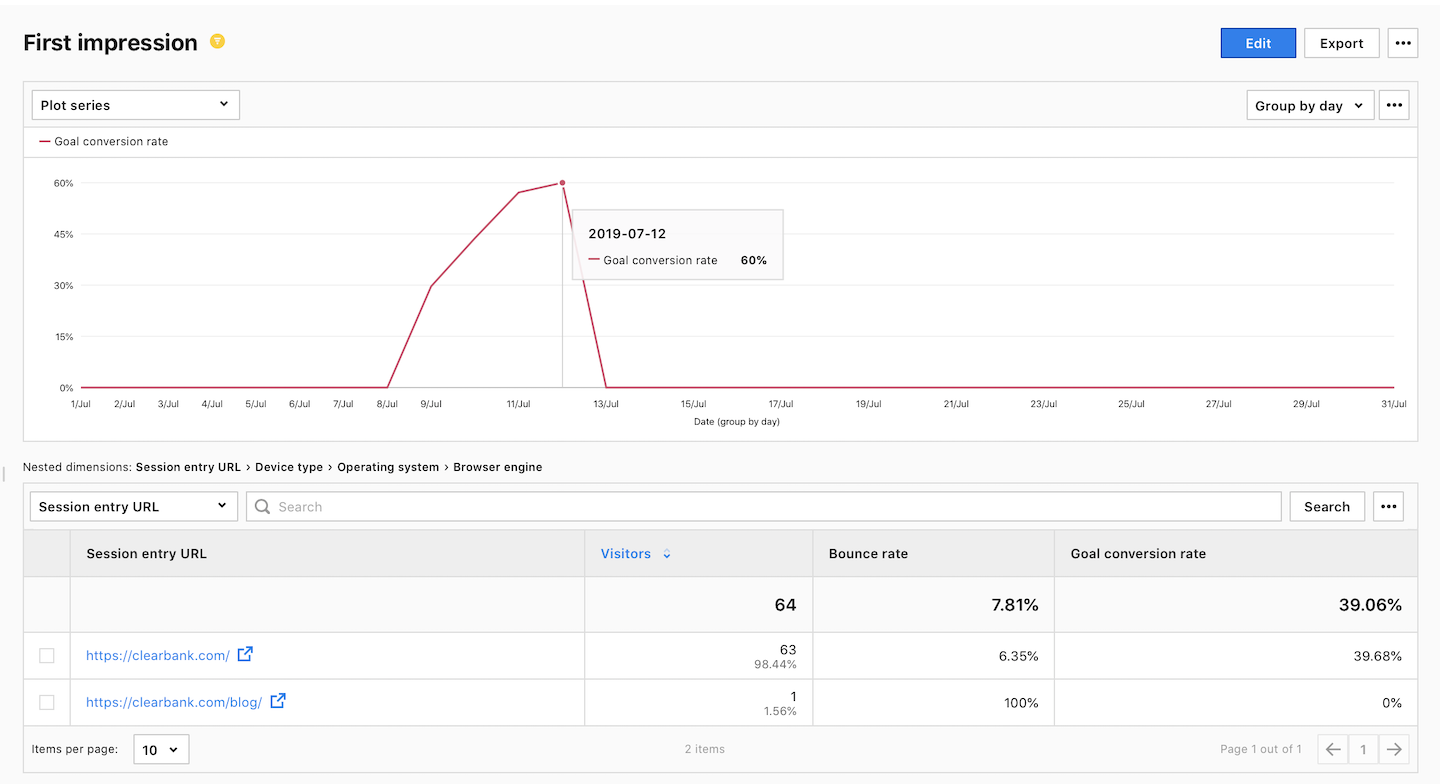
Report setup:
- Report type:
Table - Dimensions:
Session entry URL,Device type,Operating systemandBrowser engine - Metrics:
Visitors,Bounce rateandGoal conversion rate - Filter:
Returning visitor is new.
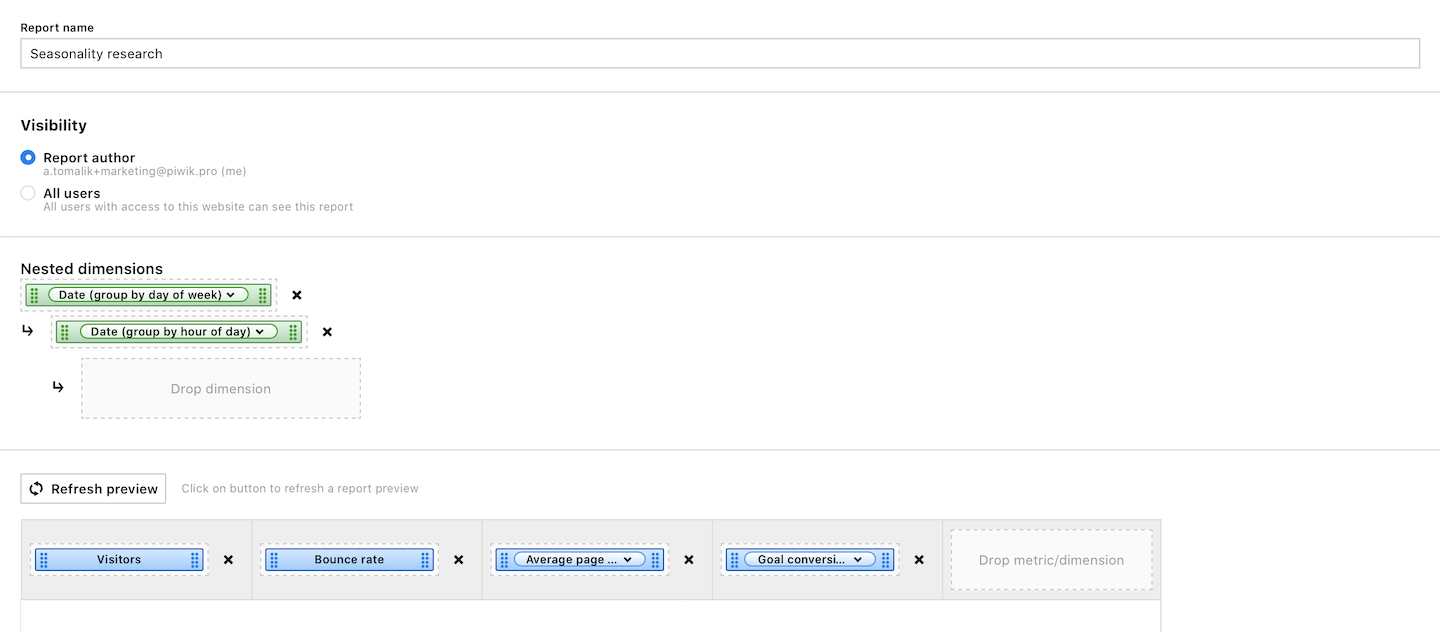
Seasonality research report
This report displays the weekly or daily traffic peaks on your website.
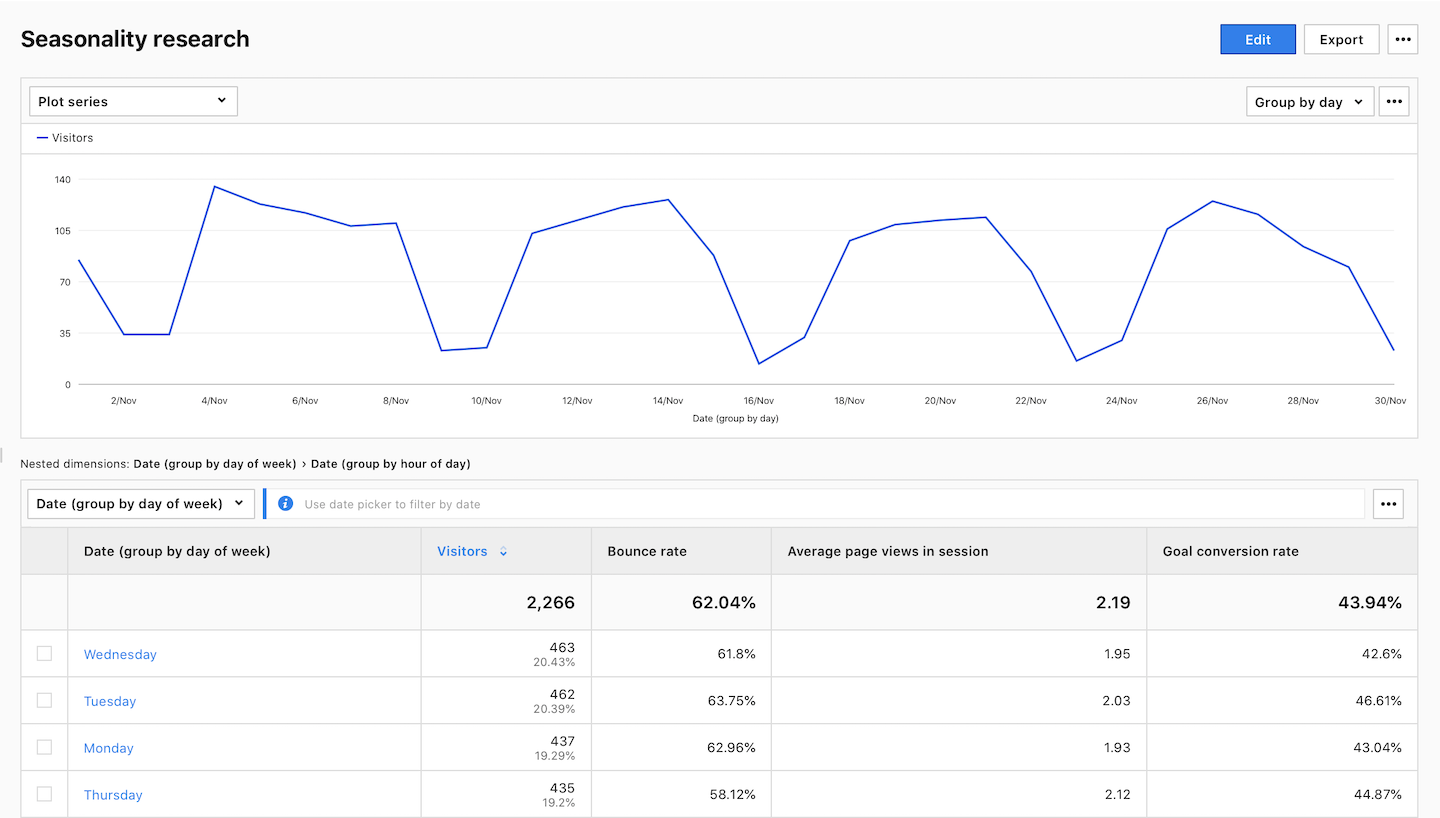
Report setup:
- Report type:
Table - Dimensions:
Date (group by day of the week)andDate (group by an hour of the day) - Metrics:
Visitors,Bounce rate,Average page views in sessionandGoal conversion rate
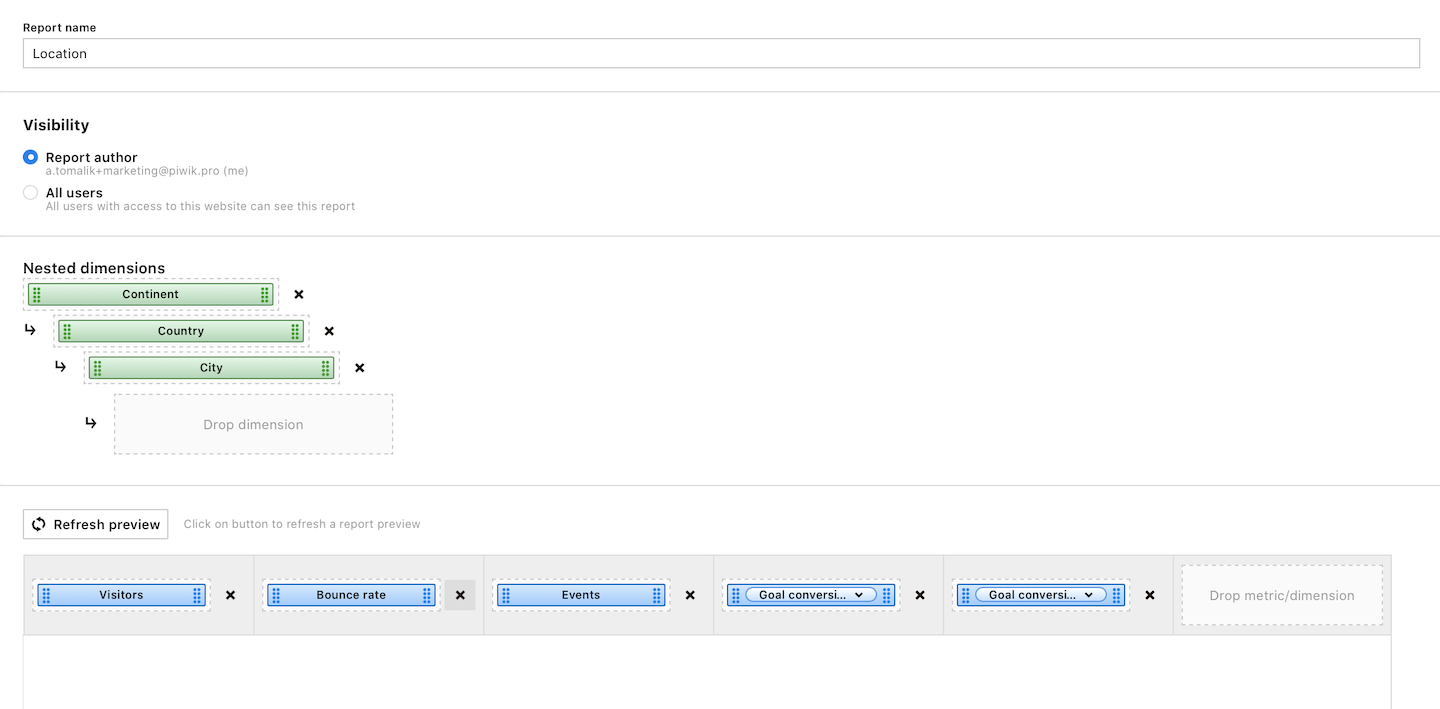
Location report
This report illustrates the popularity of your website across continents, countries and cities.
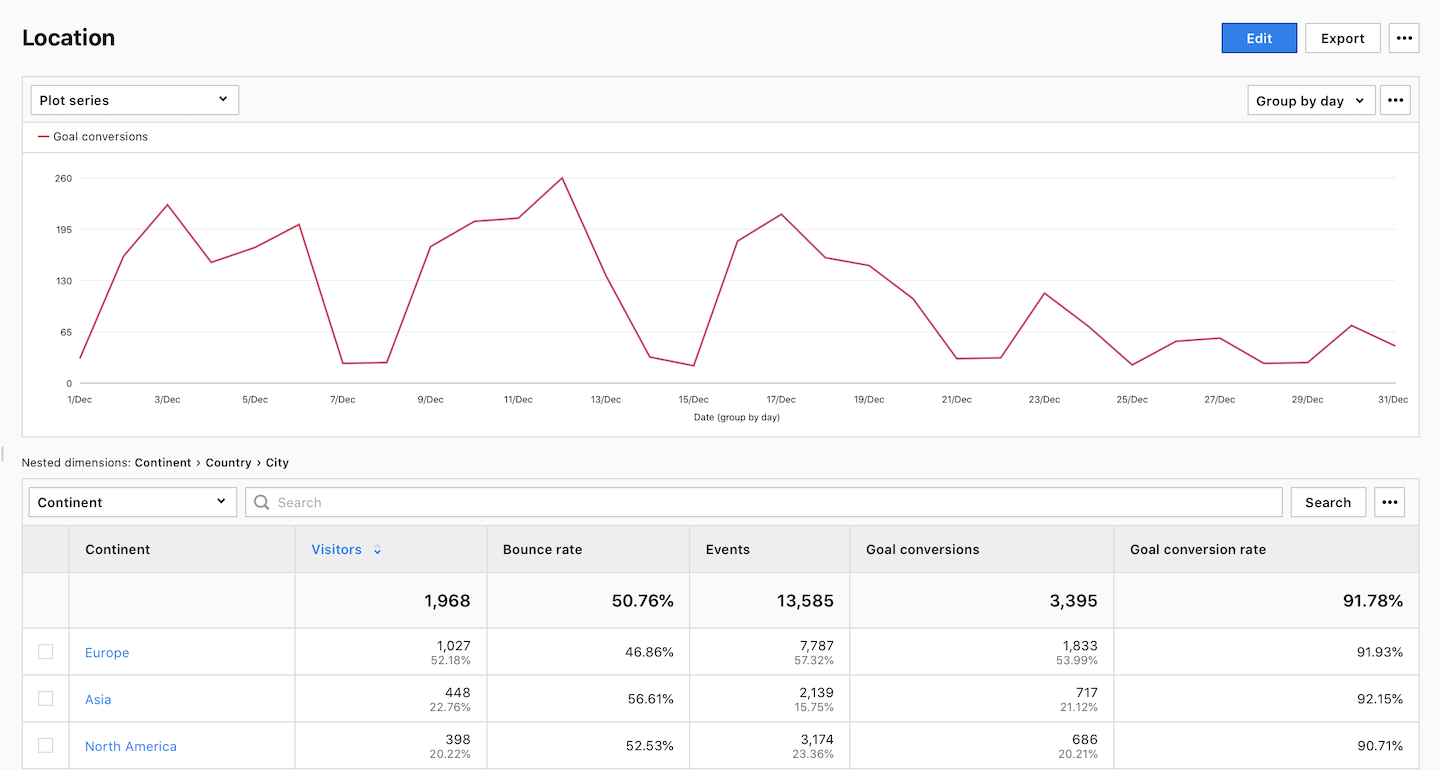
Report setup:
- Report type:
Table - Dimensions:
Continent,CountryandCity - Metrics:
Visitors,Bounce rate,Events,Goal conversionsandGoal conversion rate
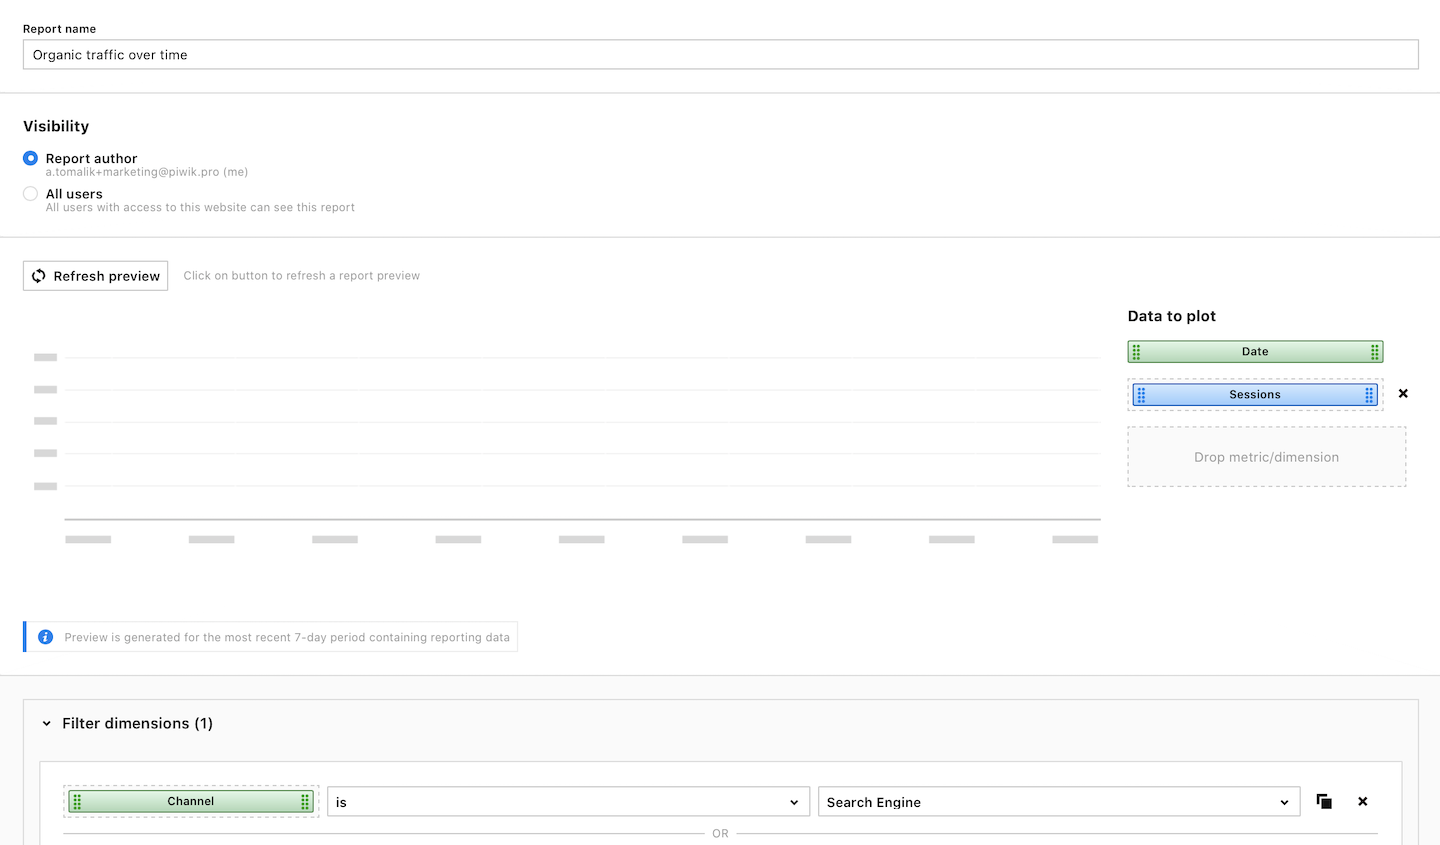
Organic traffic over time report
This report highlights the fluctuations in organic search engine traffic directed to your website.
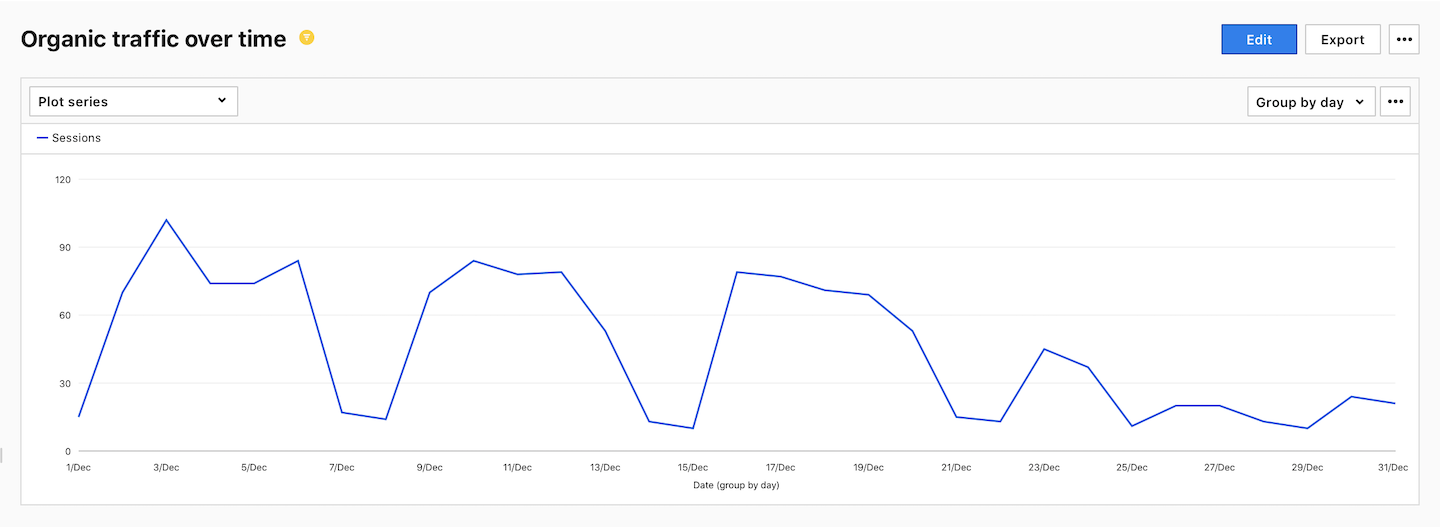
Report setup:
- Report type:
Line chart - Dimensions:
Date - Metrics:
Sessions - Filter:
Channel is Search engine
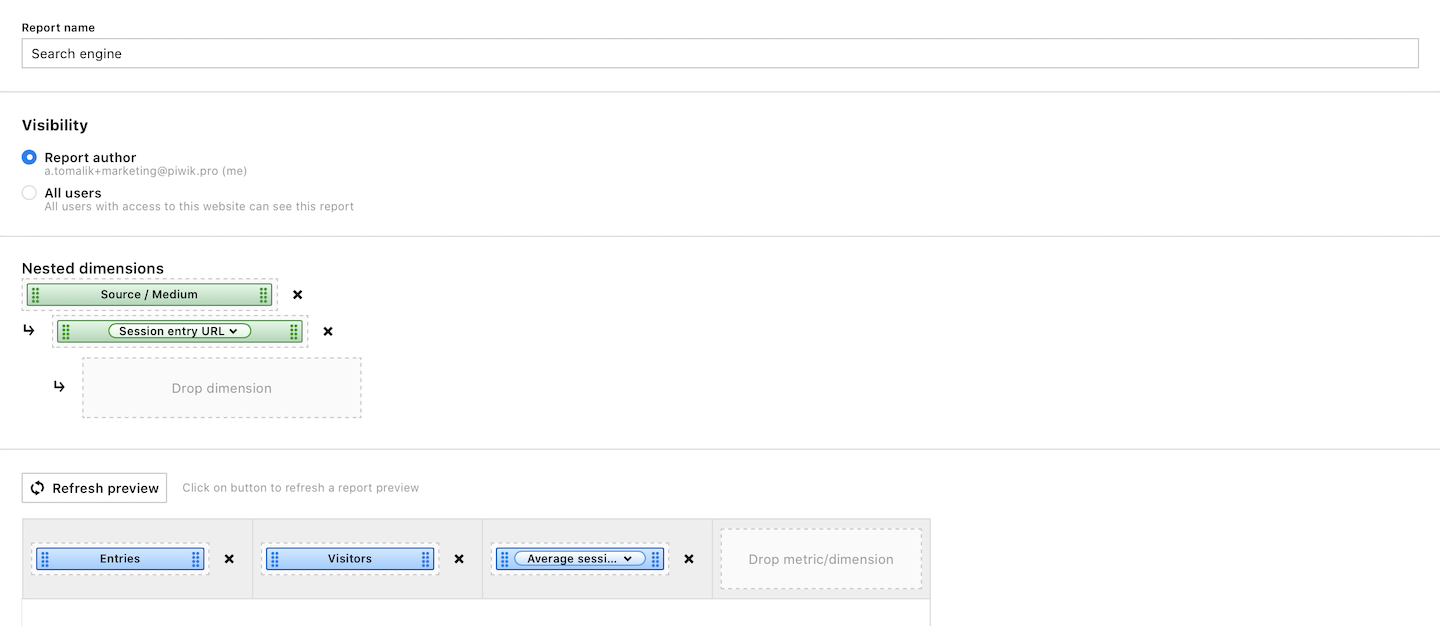
Search engine report
This report displays traffic originating from search engines like Google, Bing, Yahoo and others. It includes a nested dimension with entry page URLs, revealing the specific pages visitors found in search results.
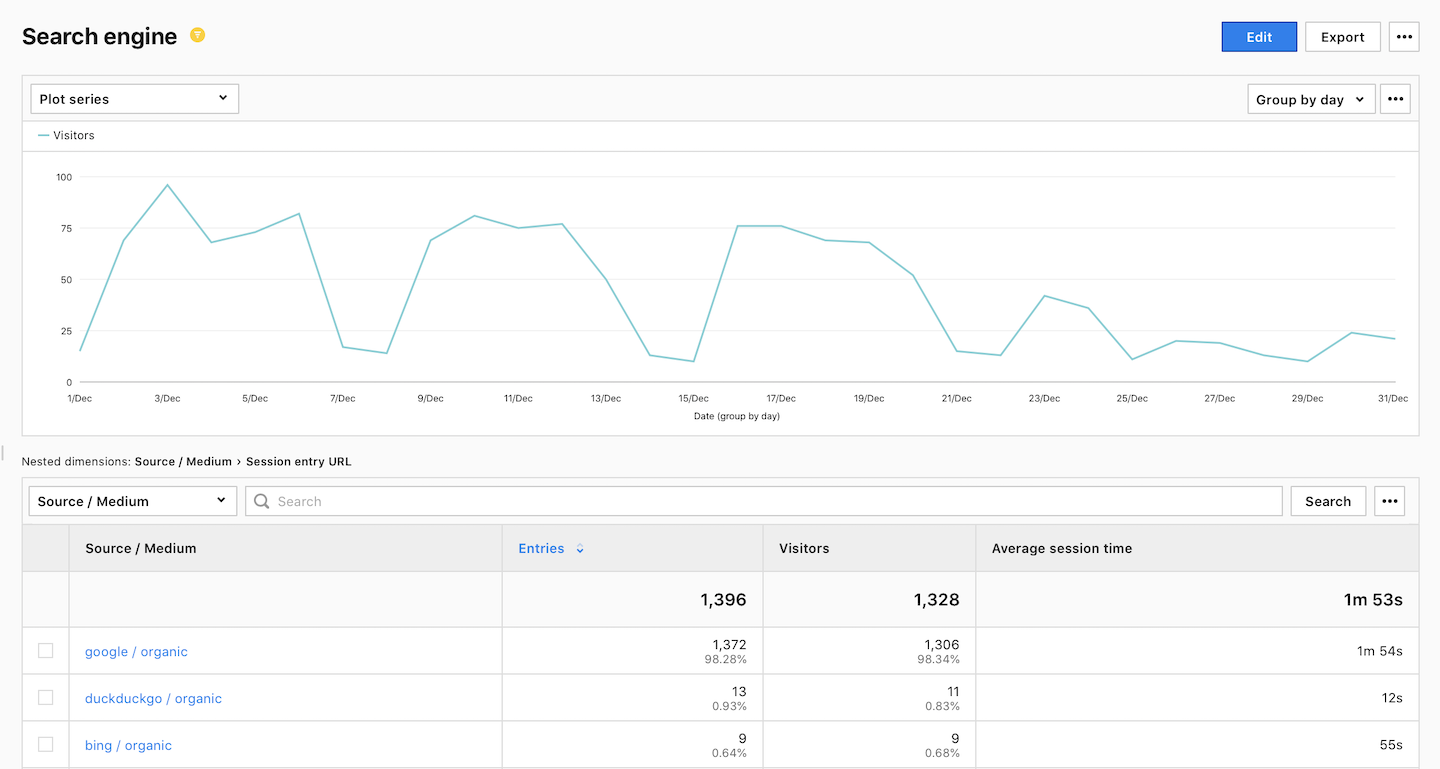
Report setup:
- Report type:
Table - Dimensions:
Source/mediumandSession entry URL - Metrics:
Entries,VisitorsandAverage session time - Filter:
Channel is Search engine
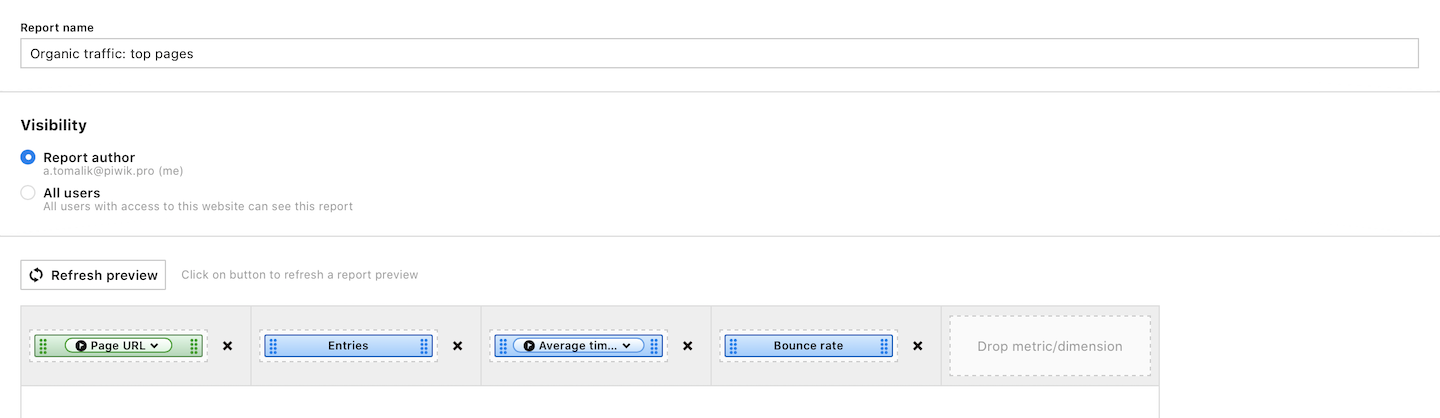
Search engine: top pages report
This report lists the pages that visitors accessed through organic search engine traffic. It serves as a valuable indicator to assess the effectiveness of your SEO efforts.
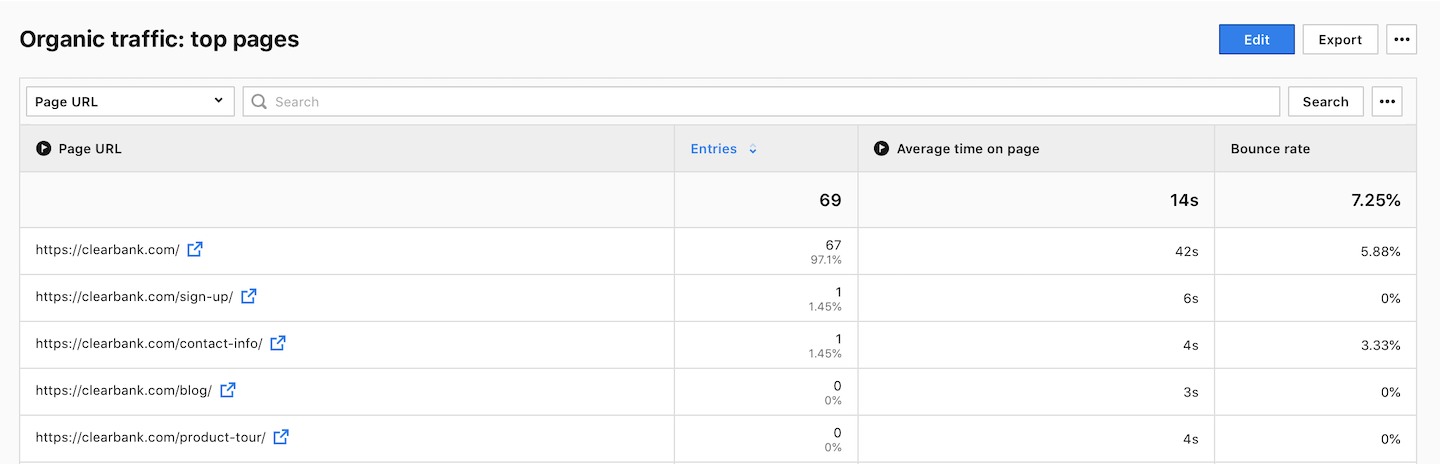
Report setup:
- Report type:
Table - Dimensions:
Page URL - Metrics:
Entries,Average time on pageandBounce rate - Filter:
Channel is Search engine
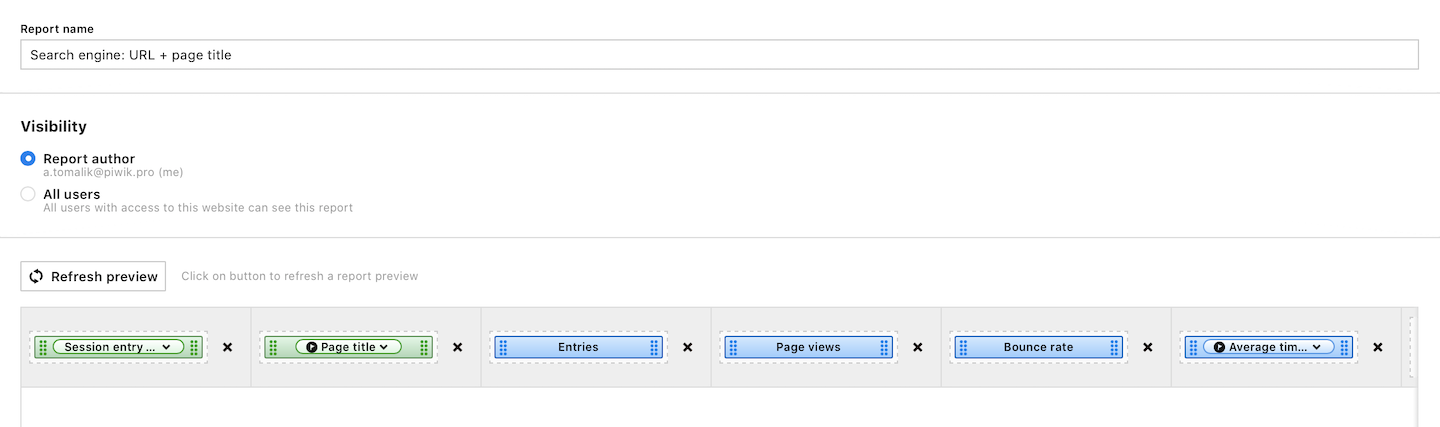
Search engine: URL + page title report
This report displays pages with titles that visitors landed on from a search engine.
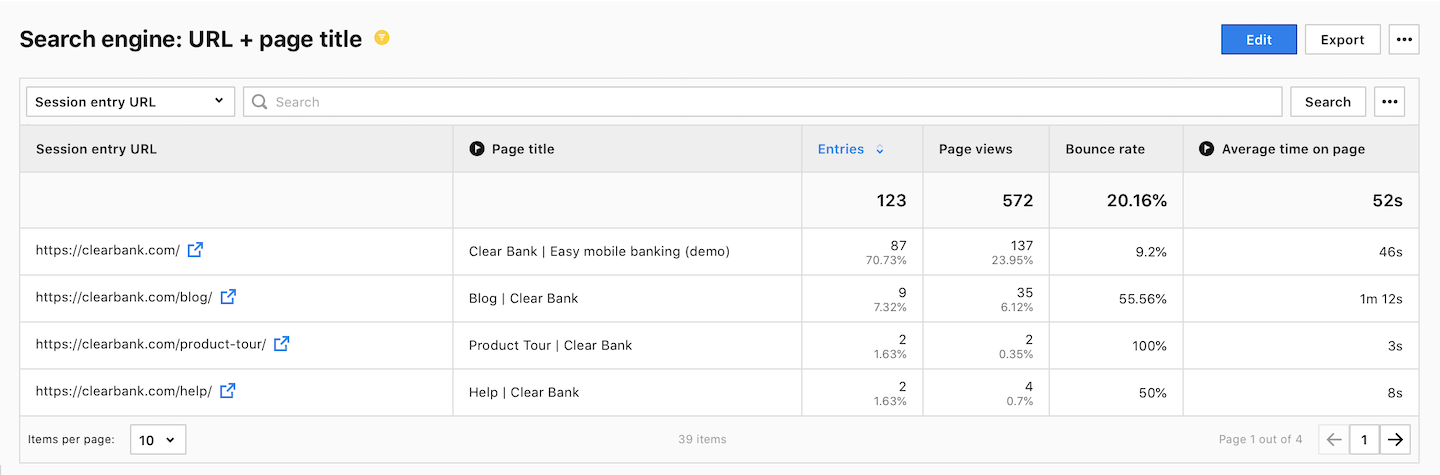
Report setup:
- Report type:
Table - Dimensions:
Session entry URLandPage title - Metrics:
Entries,Page views,Bounce rateandAverage time on page - Filter:
Channel is Search engine
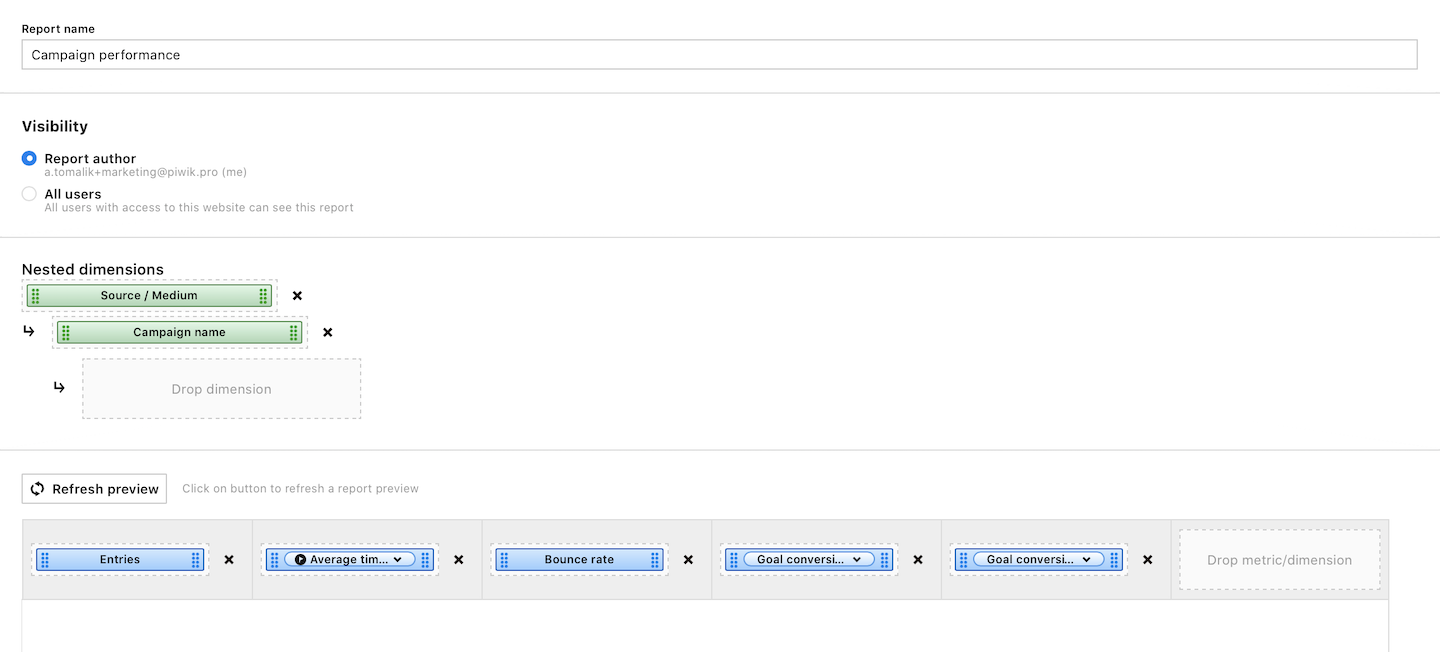
Campaign performance report
This report shows the number of visitors to your website from your online campaigns.
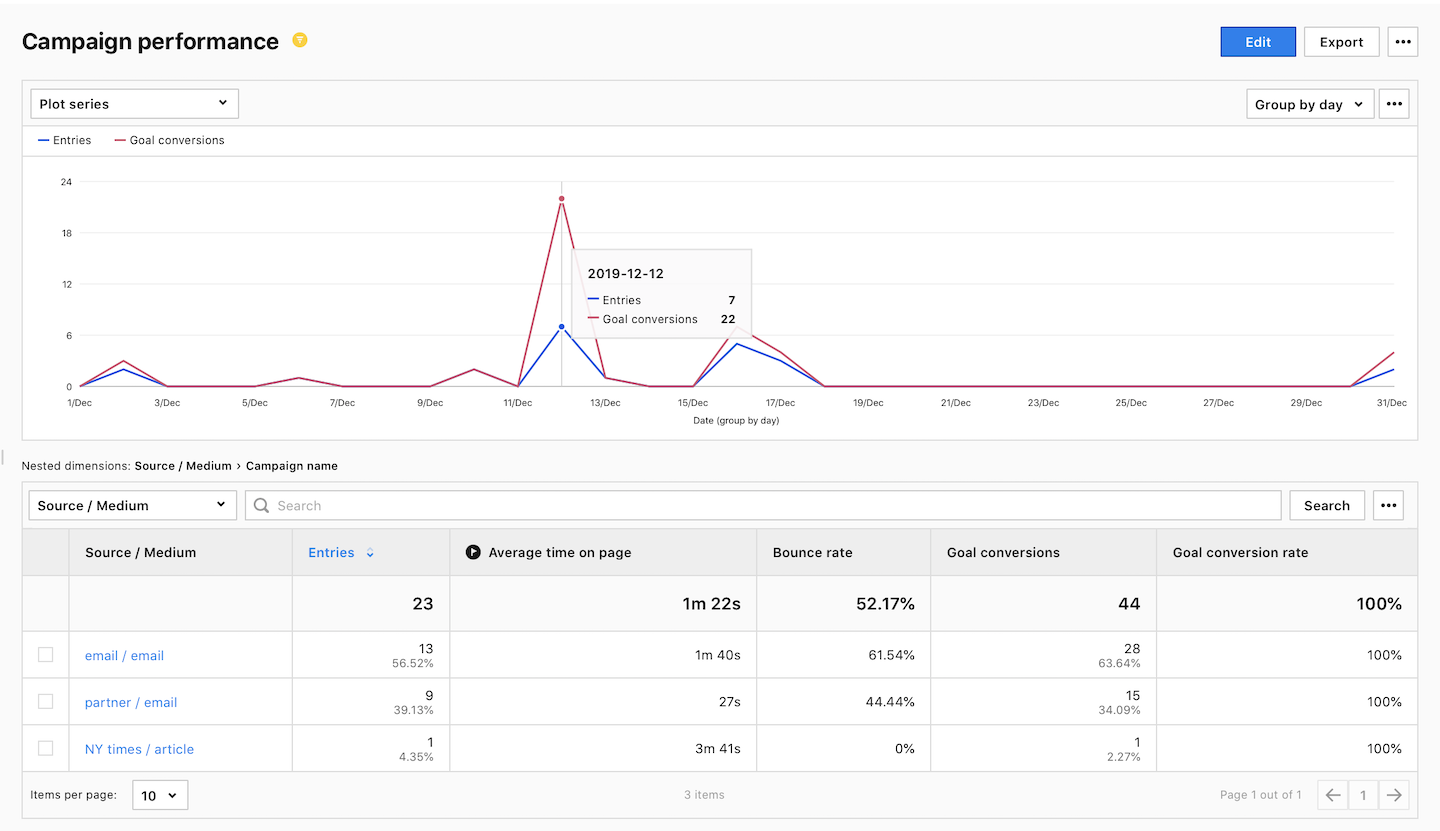
Report setup:
- Report type:
Table - Dimensions:
Source/mediumandCampaign name - Metrics:
Entries,Average time on page,Bounce rate,Goal conversionsandGoal conversion rate - Filter:
Channel is Campaign
User flow report
The user flow report provides insight into how visitors navigate through your site. Within this report, you can select a key interaction and explore preceding or subsequent interactions. In this example, we’ll look at the user flow for the blog page to see which pages visitors explore after viewing the main blog page.
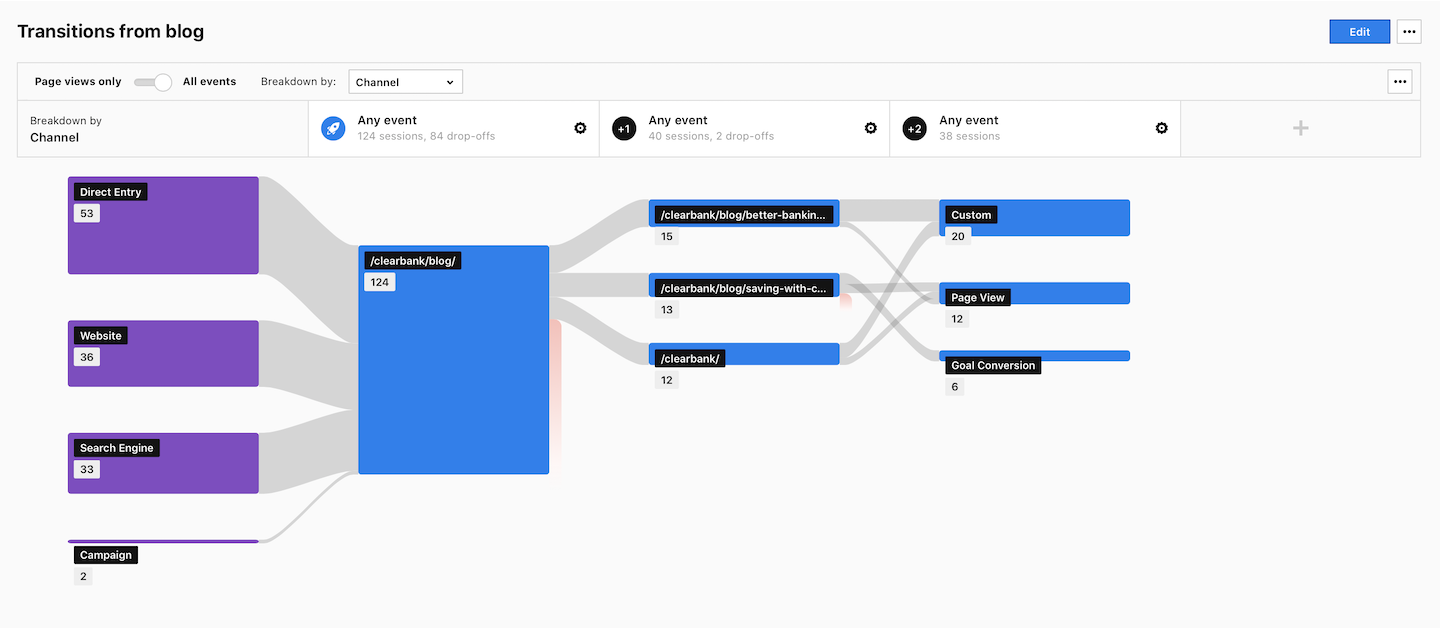
Report setup:
- Report type:
User flow - Key interaction:
Page URL is https://clearbank.com/blog/. ToggleFirst interaction in session. - +1 and +2 interaction:
Page view
Tip: For more, read: Set up a user flow report.
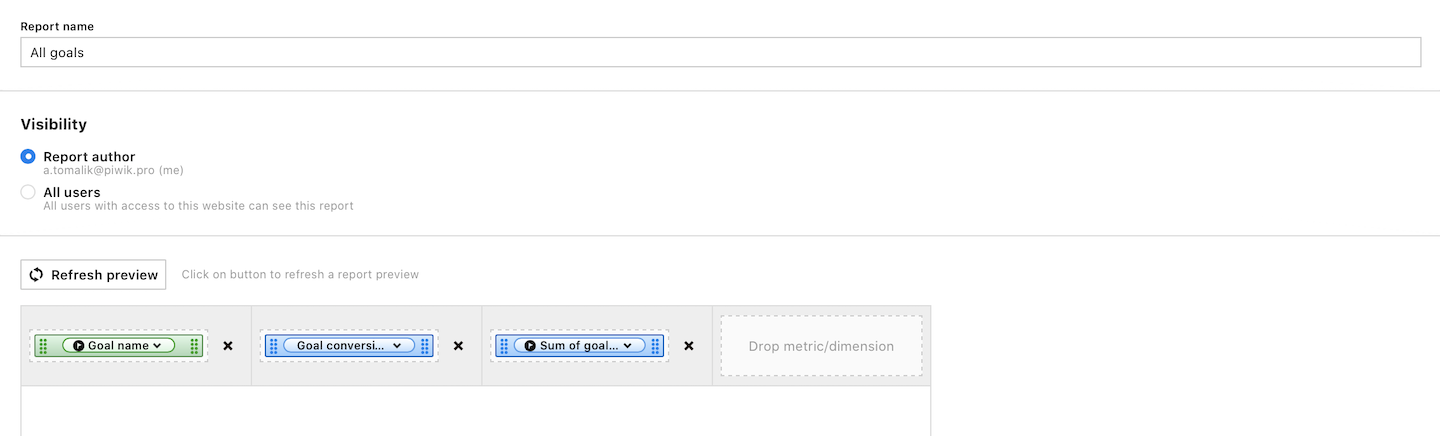
Goal report
This report displays conversions and total revenue for each defined goal on your website.
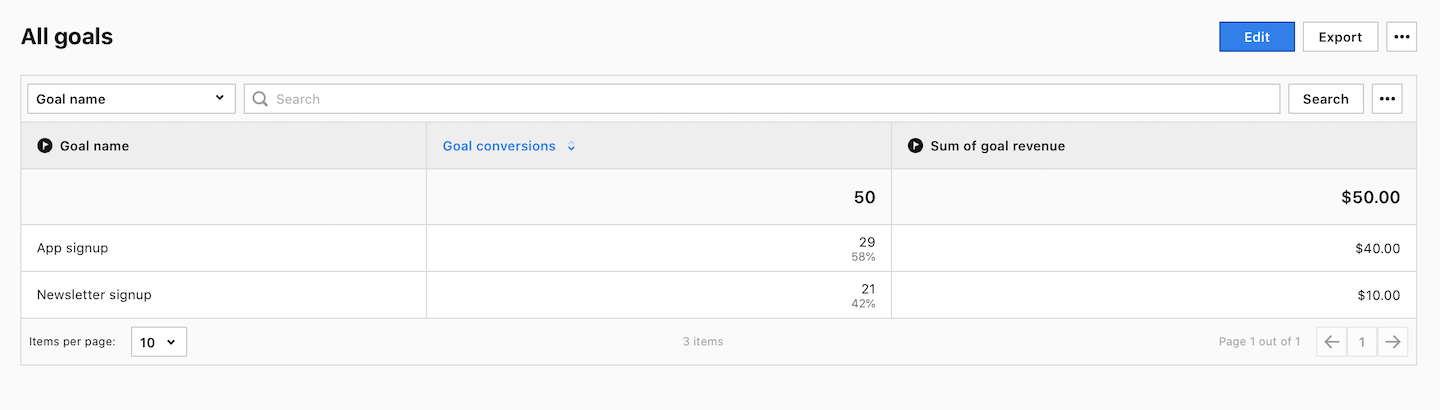
Report setup:
- Report type:
Table - Dimensions:
Goal name - Metrics:
Goal conversionsandSum of goal revenue
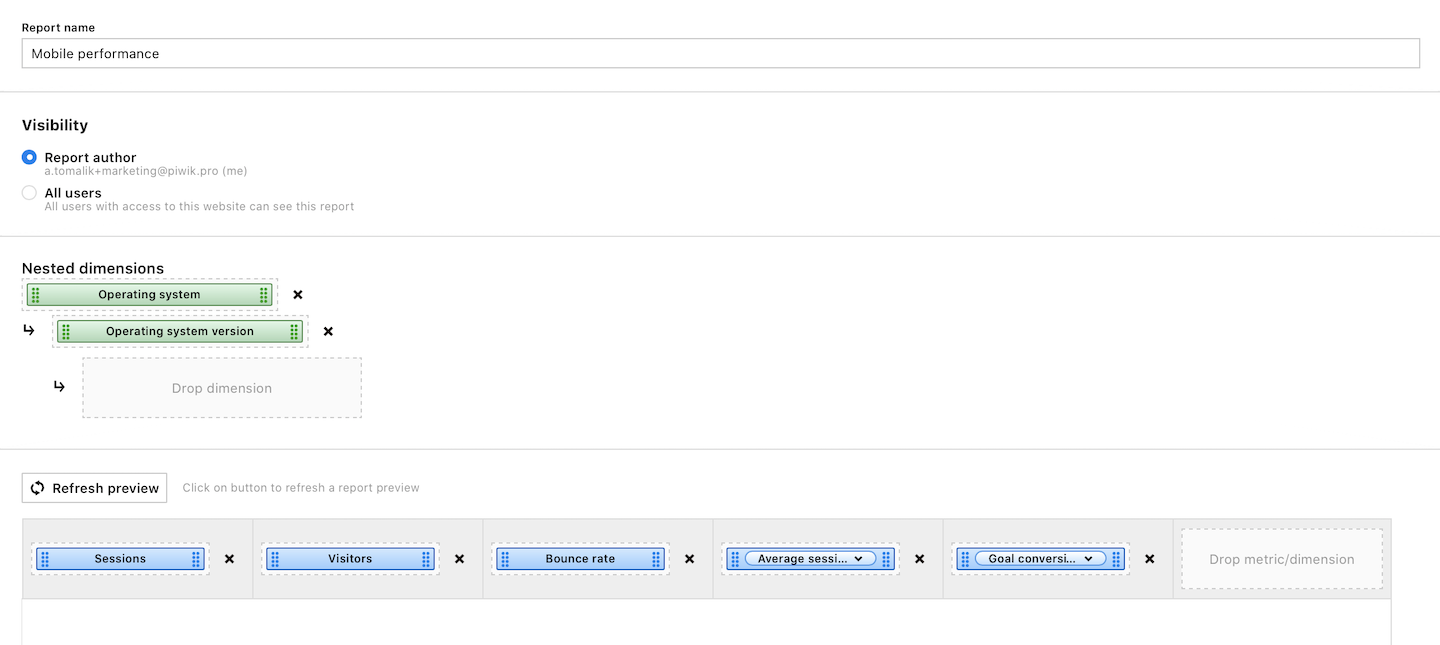
Mobile performance report
This report provides insight into traffic from mobile devices, including their respective mobile operating systems. It serves as a useful tool for quickly identifying any issues that may be occurring on these devices.
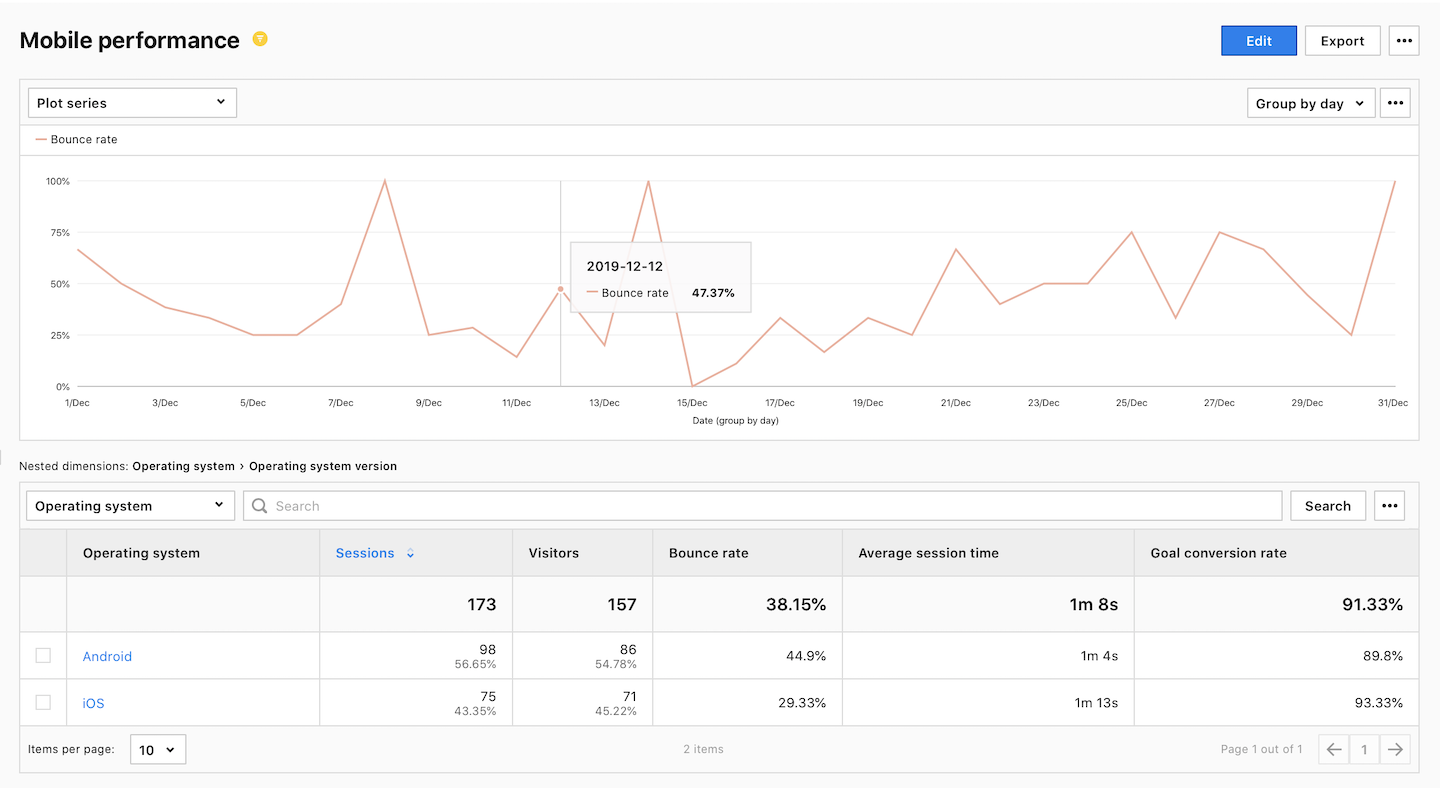
Report setup:
- Report type:
Table - Dimensions:
Operating systemandOperating system version - Metrics:
Sessions,Visitors,Bounce rate,Average session timeandGoal conversion rate - Filters:
Device type is Smartphone;Device type is Feature phone.
Note: You can use folders to organize your dashboards, goals, and custom reports. Add shared or private folders directly in the UI, no setup needed.