Custom reports can help you better analyze your goals. That’s because they allow you to handpick the metrics and dimensions for your report, making your analysis more focused.
In this article, we’ll guide you through the process of setting them up.
Before you start
Here are some things to know before you begin:
1. Before you create custom reports, you need to set up your goals.
2. Goals use the following dedicated metrics and dimensions:
- Goal conversions: This measures the number of times visitors successfully achieved a goal. For example, if 120 people sign up for a trial on your website, the goal conversion count will be 120.
- Goal conversion rate: This represents the percentage of sessions during which people achieve a goal. If there were 1000 sessions on your website and 120 of them resulted in trial sign-ups, the goal conversion rate would be calculated as: 120/1000 = 0.12 (12%).
- Goal revenue: This is the revenue associated with a specific goal. For example, if you determine that each trial sign-up is worth $50 for your company, you can set the goal revenue at $50. In your reports, you can view the total sum of all goal revenues, along with other metrics such as minimum, maximum, median or average values.
- Goal name: This is simply the name you’ve given to the goal for easy identification.
3. When analyzing goals in custom reports, don’t use the goal name as a dimension together with the goal conversion rate. The counting mechanism will limit the data to sessions in which the goal was achieved, and the goal conversion rate will always be 100%.
4.
Create a custom report for all goals
First, let’s create a report that displays our goals, conversions and revenue.
To create a custom report for goals, follow these steps:
1. Go to Menu > Analytics.
2. Navigate to Custom reports.
3. Click Add a report.
4. Choose the following type: Table.
5. Name the report.
6. In Visibility, choose Author or All users. All users lets you share this dashboard with your teammates.
7. Enter "goal" in the search bar to filter the dimensions and metrics used for goals.
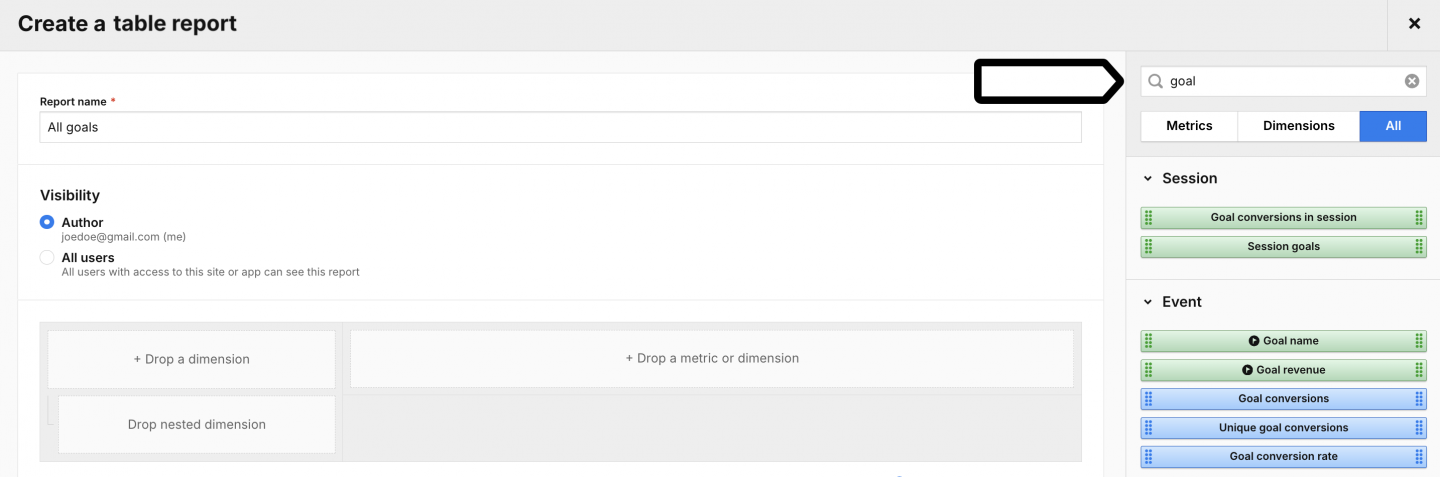
8. Select the following dimensions and metrics: Goal name, Goal conversion, Goal revenue and once again Goal revenue.
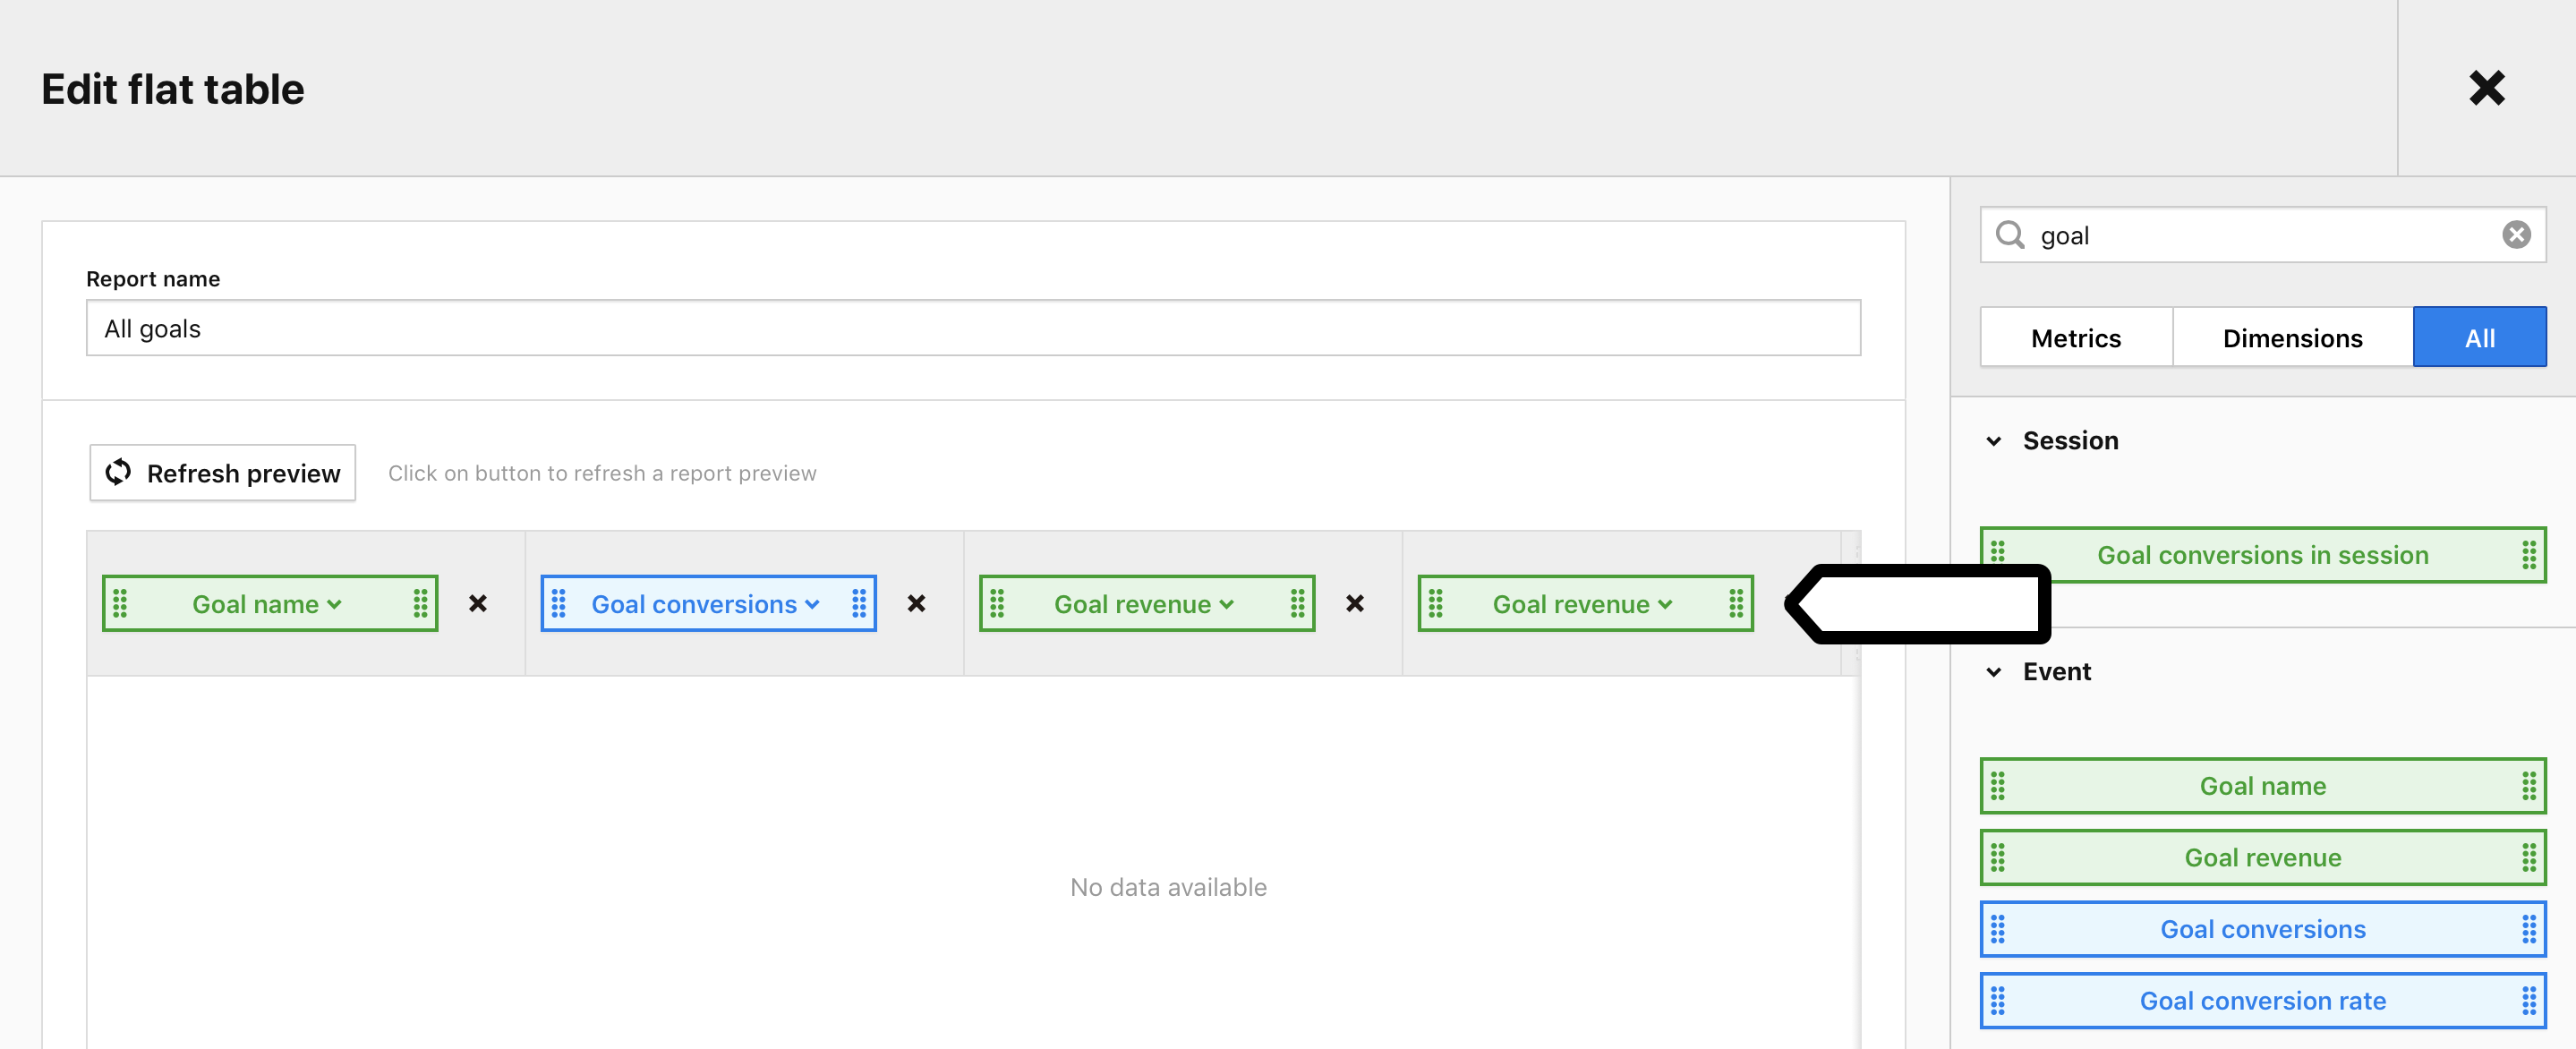
Tip: Don’t use the goal conversion rate for this case because the counting mechanism will limit the data to sessions in which the goal was achieved, and the goal conversion rate will always be 100%.
9. Click Goal revenue to access the drop-down menu and select Sum of goal revenue.

10. Click Save.
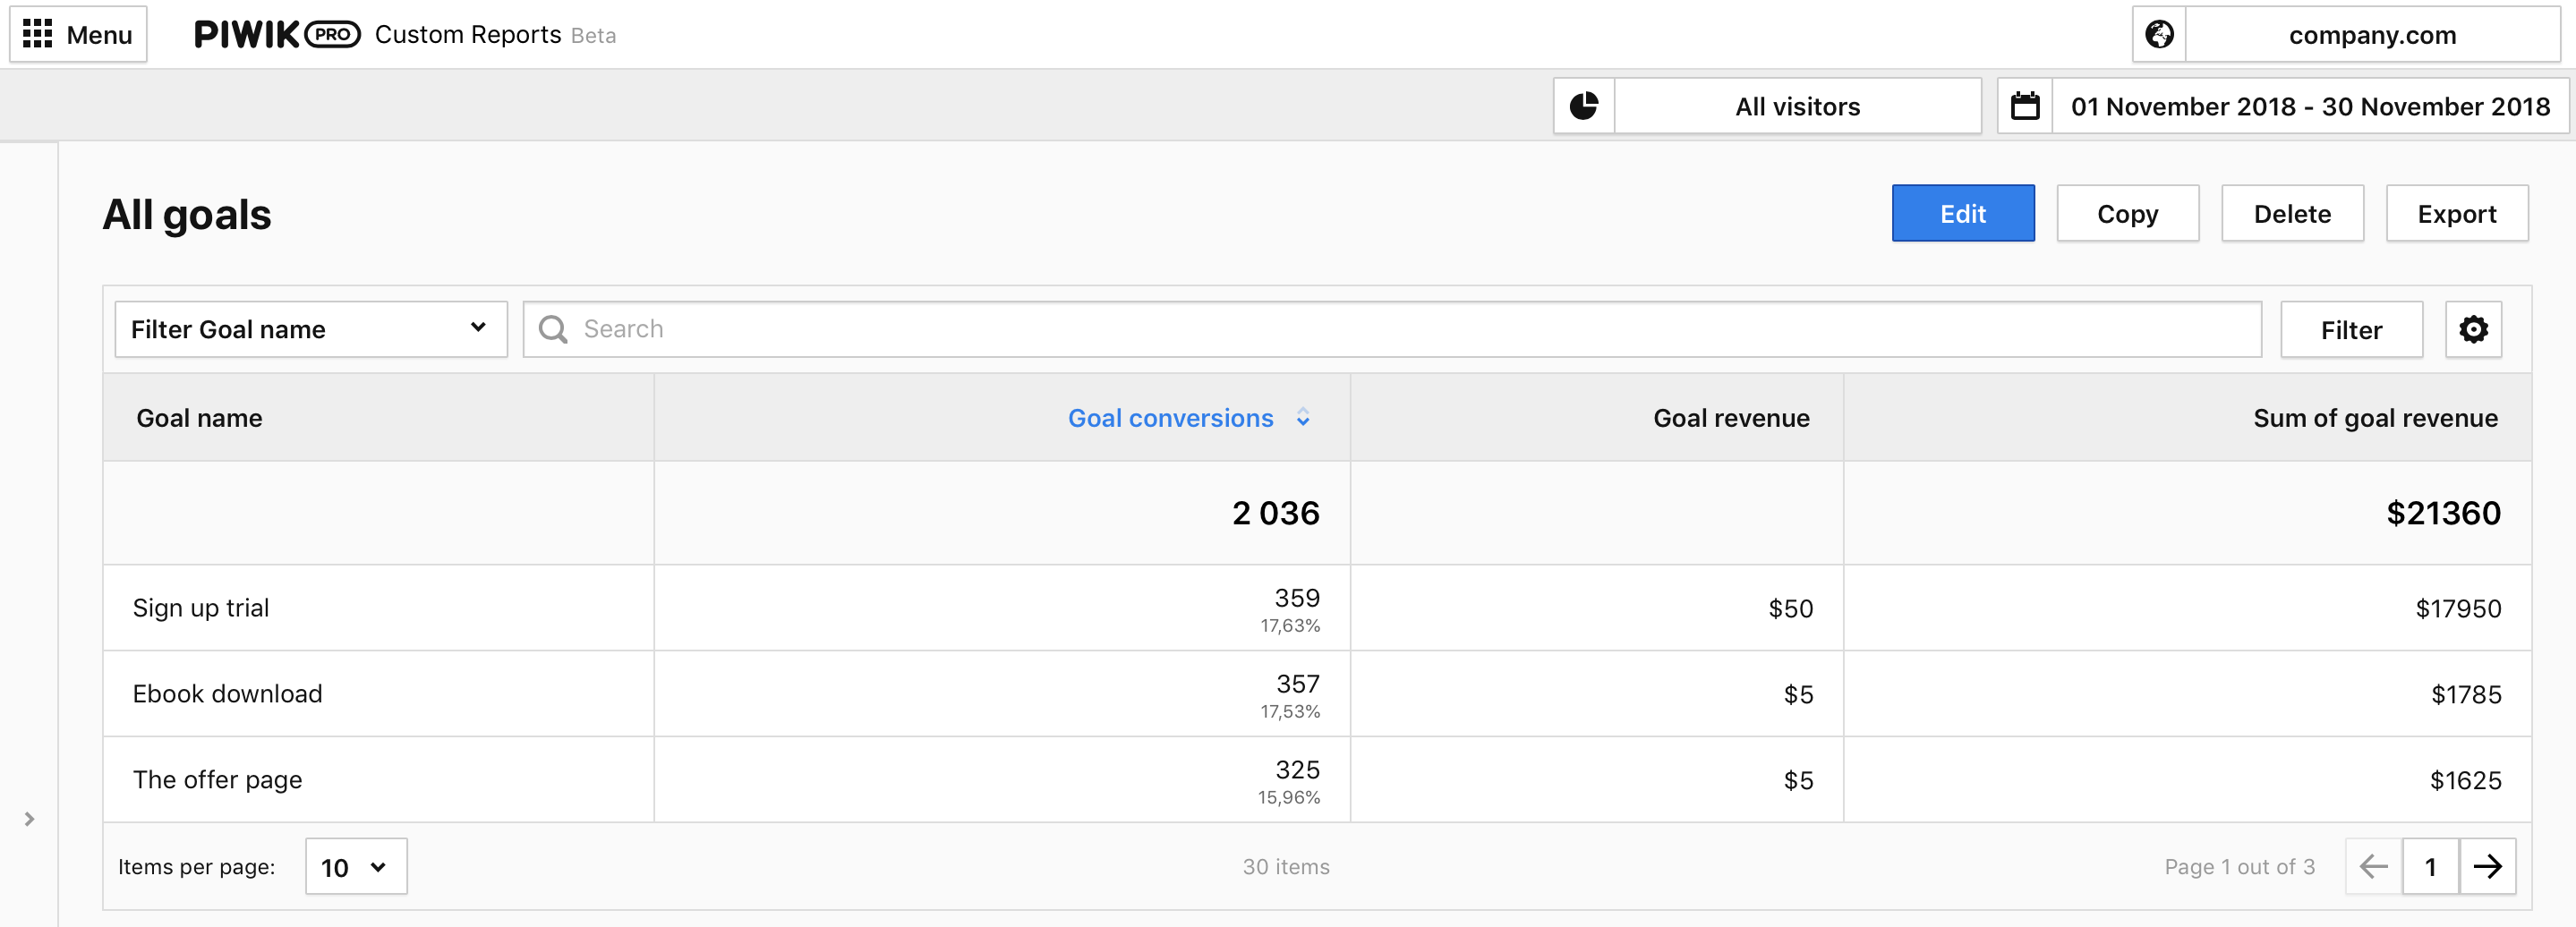
11. Done! You can now view your report.
See which traffic channels are driving goal conversions
Next, you can create a custom report that highlights channels and goal conversions. This combination of data will provide valuable insights into the traffic sources bringing customers to your website.
To create a custom report for channels and goals, follow these steps:
1. Go to Menu > Analytics.
2. Navigate to Custom reports.
3. Click Add a report.
4. Choose the following type: Table.
5. Name the report.
6. In Visibility, choose Author or All users. All users lets you share this dashboard with your teammates.
7. Select the following dimensions and metrics: Channel, Goal conversion, Goal conversion rate, Goal revenue and once again Goal revenue.
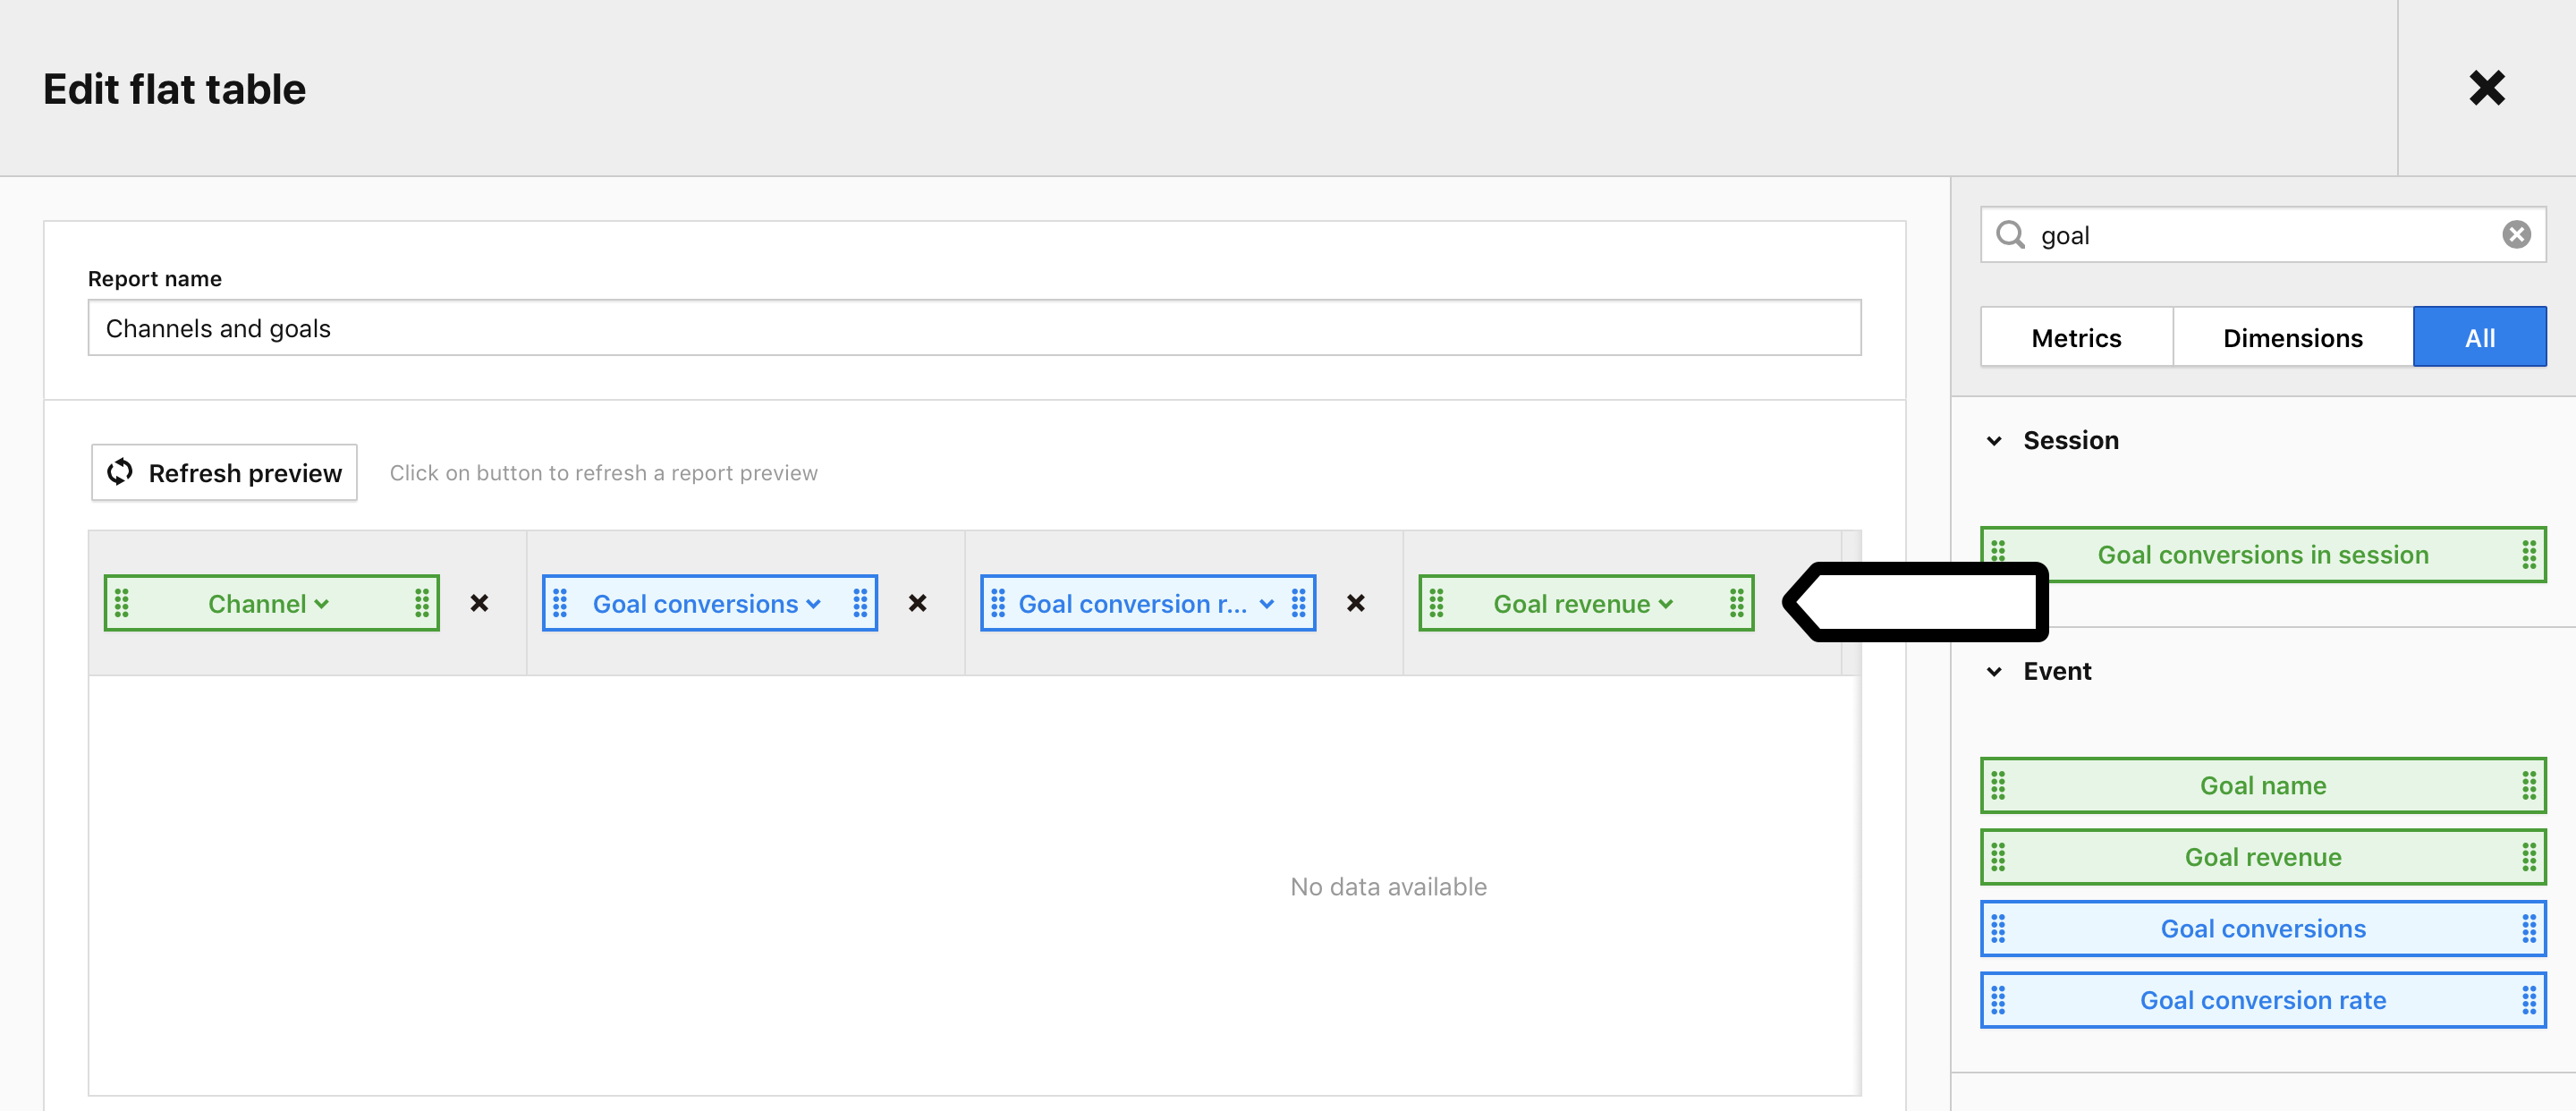
8. Click Goal conversion to access the drop-down menu and select the goal you want to analyze.
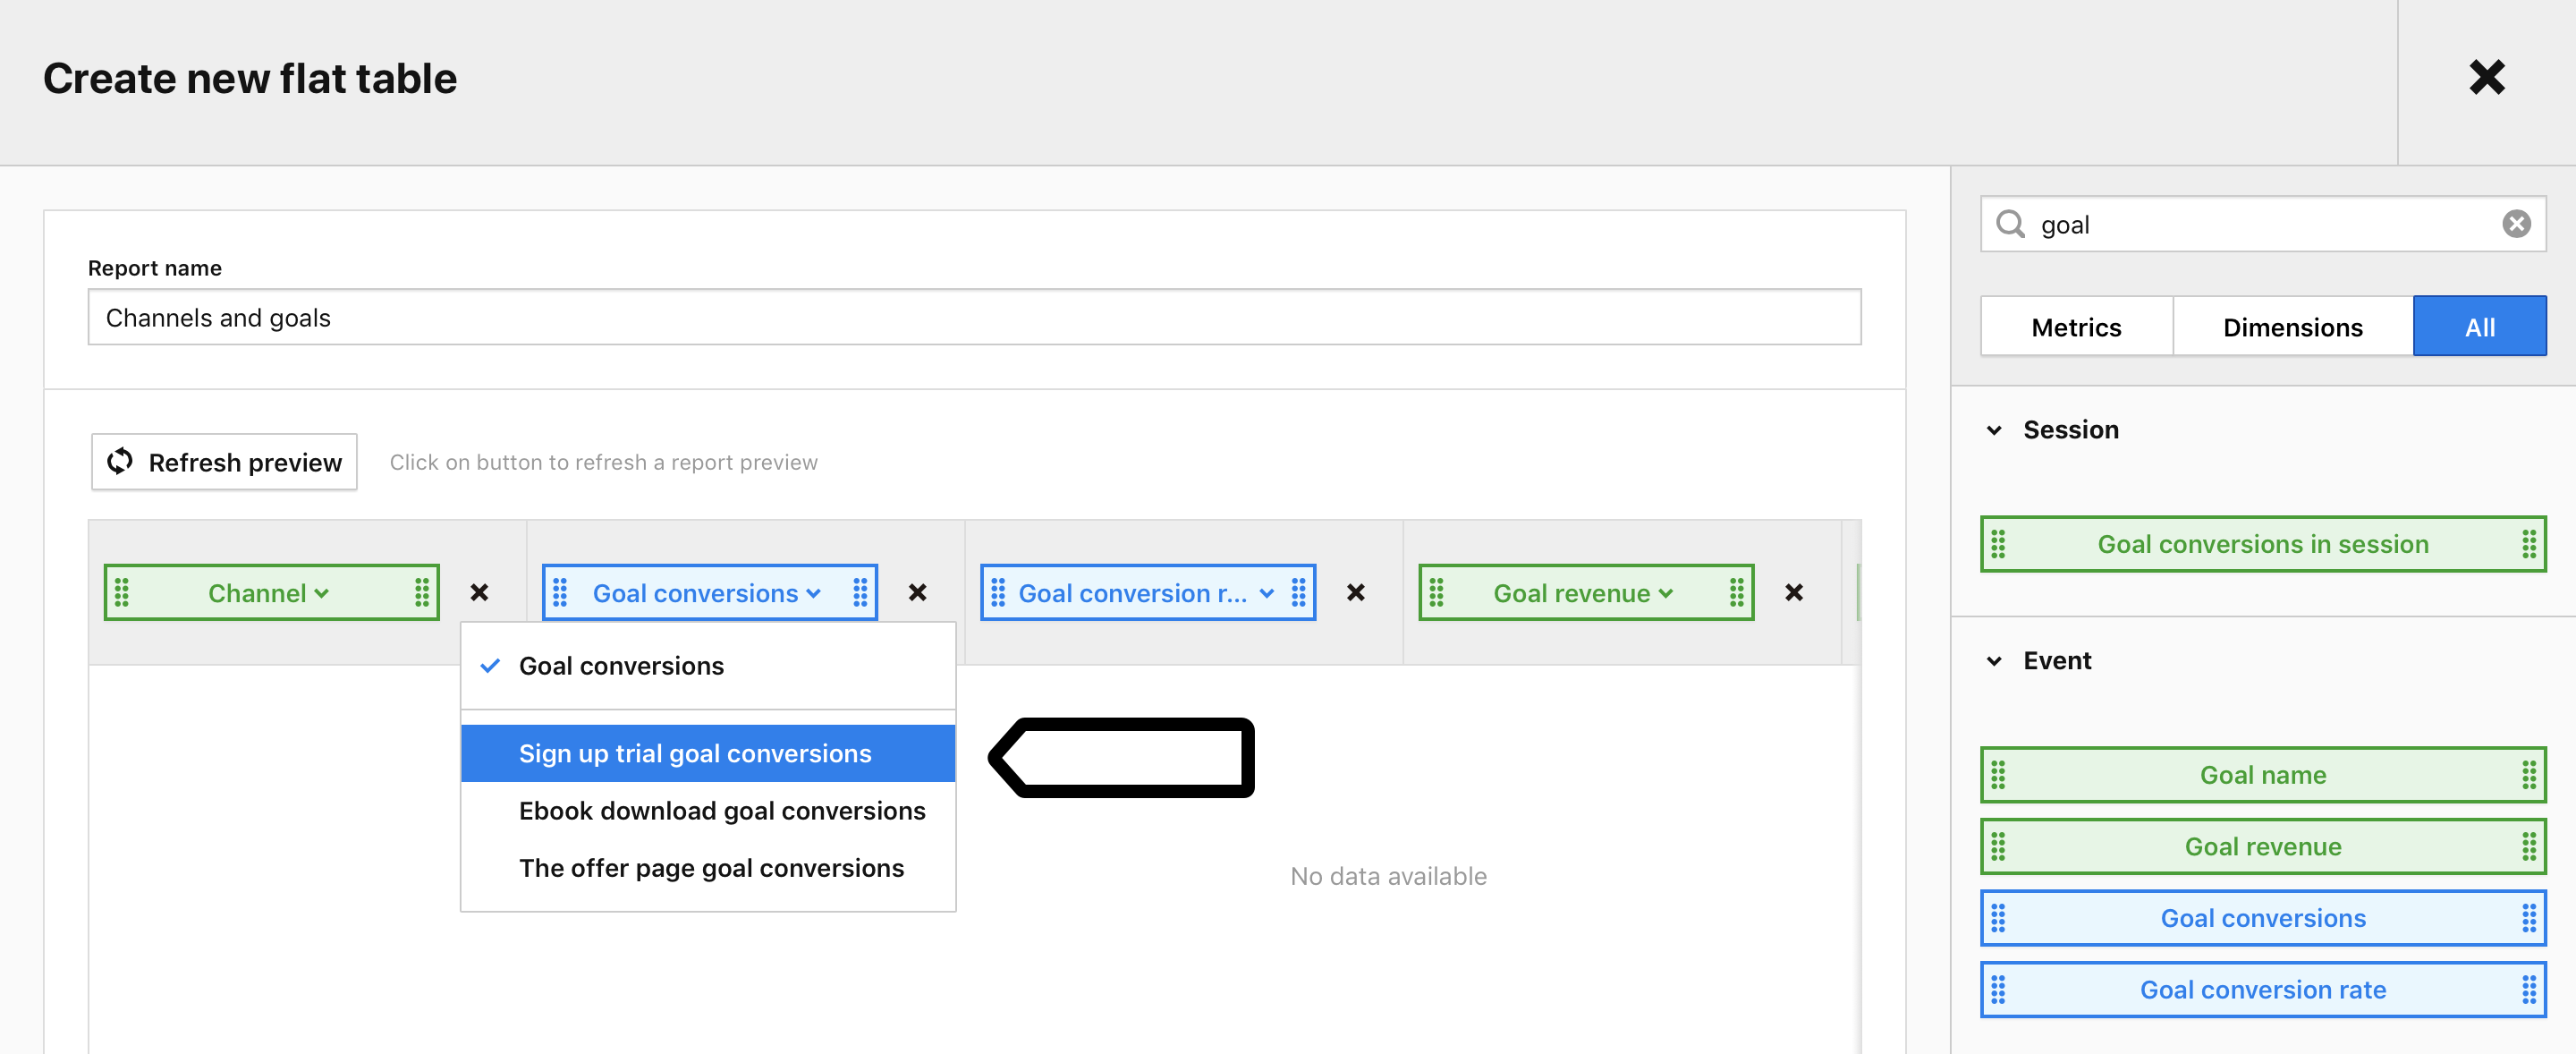
9. Click Goal conversion rate to access the drop-down menu and select the goal you want to analyze.
10. Click Goal revenue to access the drop-down menu and select the total goal revenue.
11. Click Save.
12. All done! You can now view your report.
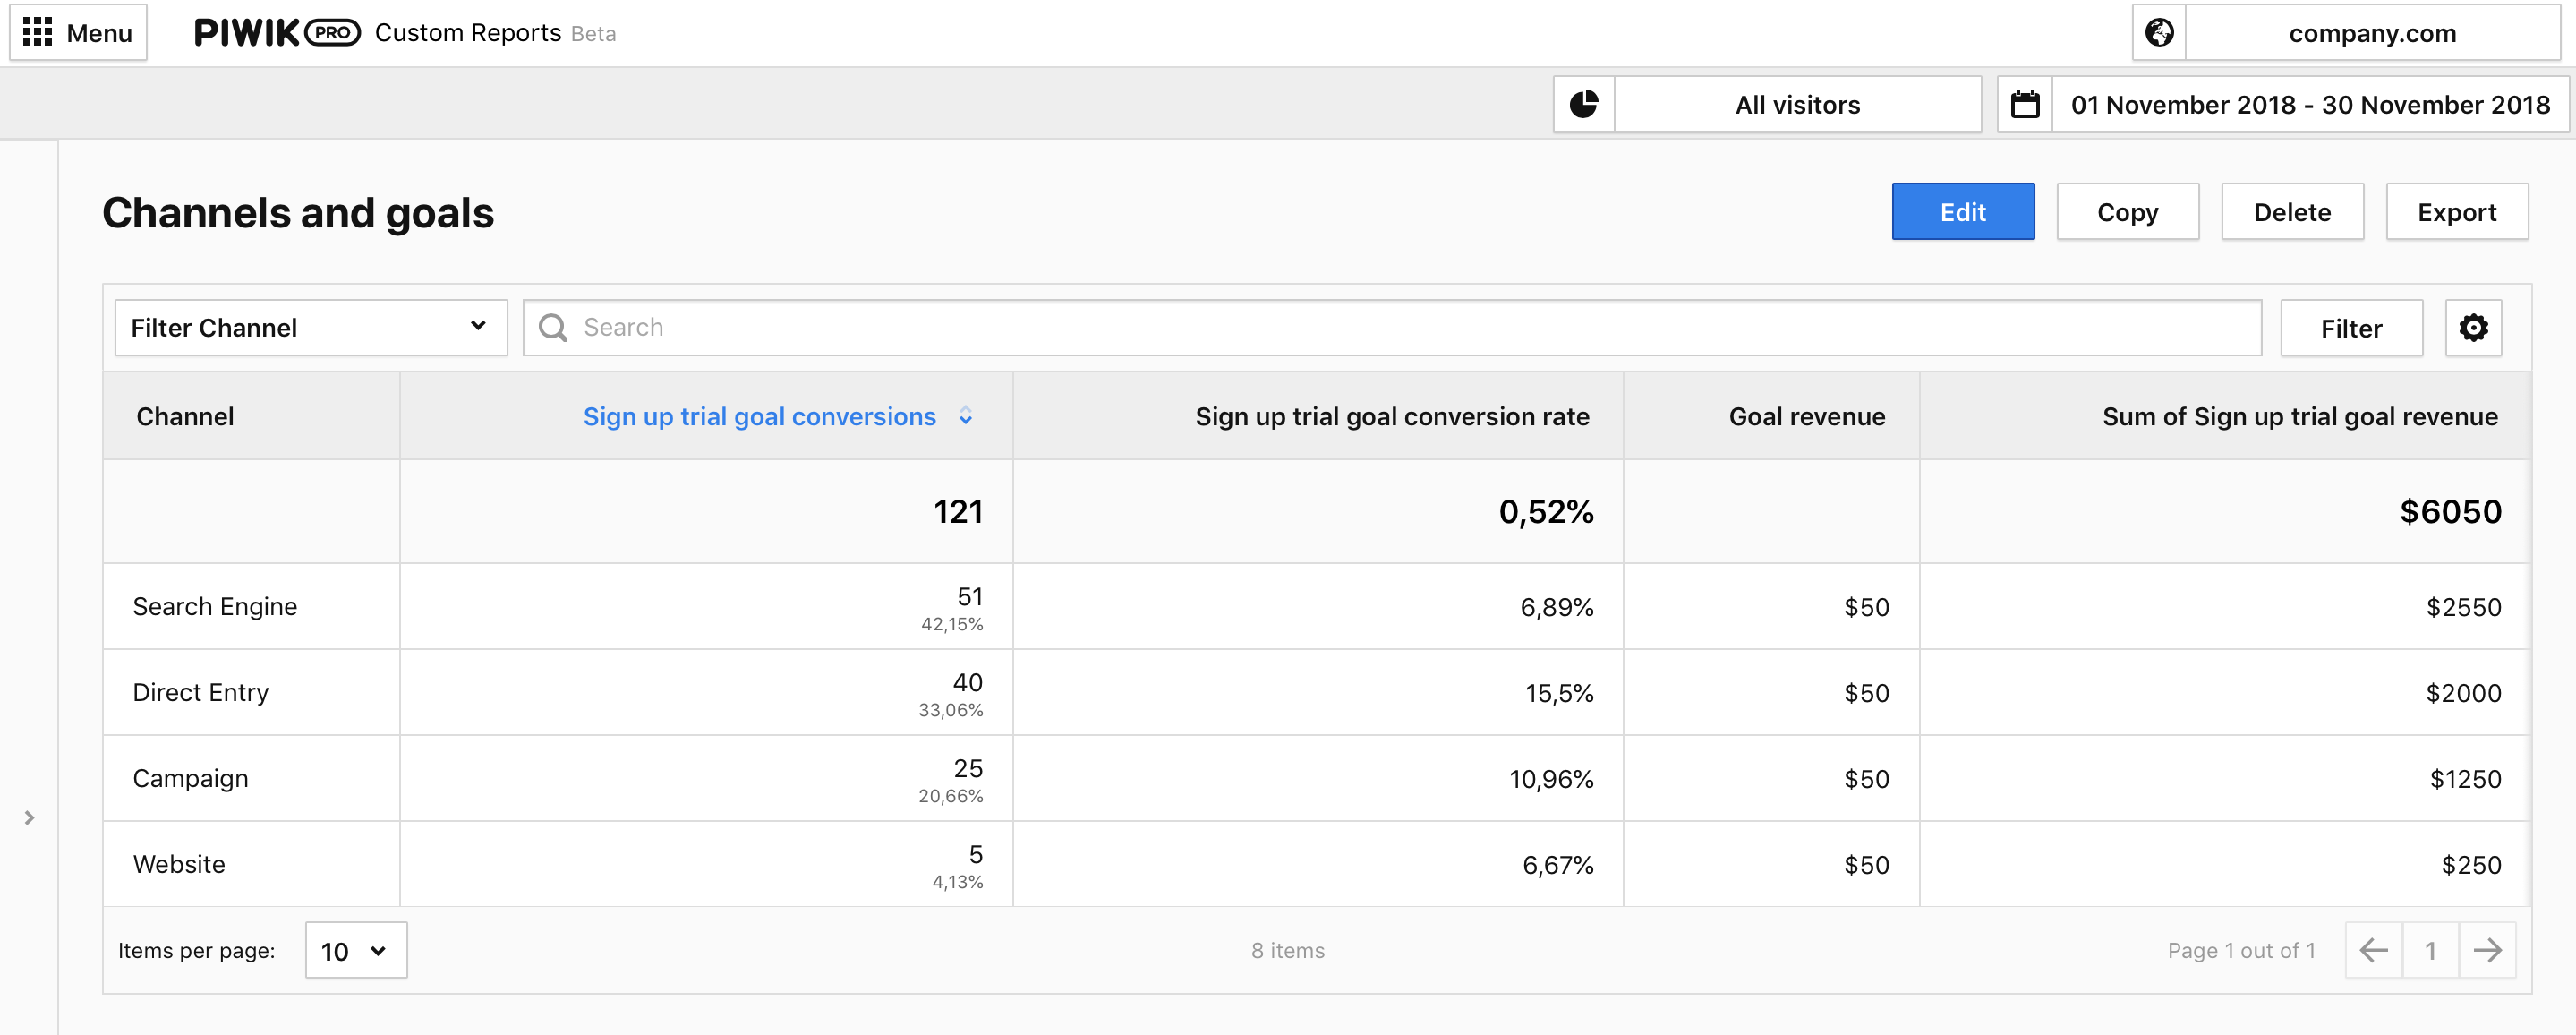
Tips:
- You can create this type of report for any goal you track to find out which traffic channels are leading to conversions.
- You can use folders to organize your dashboards, goals, and custom reports. Add shared or private folders directly in the UI, no setup needed.