In Piwik PRO, dimensions are initially grouped by default. This default grouping is suitable for most users. However, if you wish to arrange the content differently, you can use dimension value grouping. Let’s explore this with an example.
Here’s the default grouping for the Country dimension:
- Australia
- Denmark
- Germany
- Netherlands
- United Kingdom
- United States
- New Zealand
Note: The Country dimension includes all countries, but for this example, we’ve provided a shortened list.
Now, when you organize values into custom groups, your list might look something like this:
- United States+United Kingdom
- Australia+New Zealand
- Others
The reasons for organizing content differently than the default arrangement can vary among users. In most cases, it helps create cleaner reports and provides a better understanding of data specific to your site.
In this article, we’ll guide you through the process of grouping your dimension values.
Before you start
Here are some things to know before you begin:
- You can create up to 10 groups in one custom grouping.
- Custom grouping is not available in filters. However, you can apply the same conditions to the filter as you would for custom grouping and the effect will be the same.
- If a value belongs to two or more groups, it will be assigned to the first group from your setup. It won’t belong to any other groups.
Create a custom grouping
To group dimension values, follow these steps:
1. Go to Menu > Analytics.
2. Navigate to Settings.
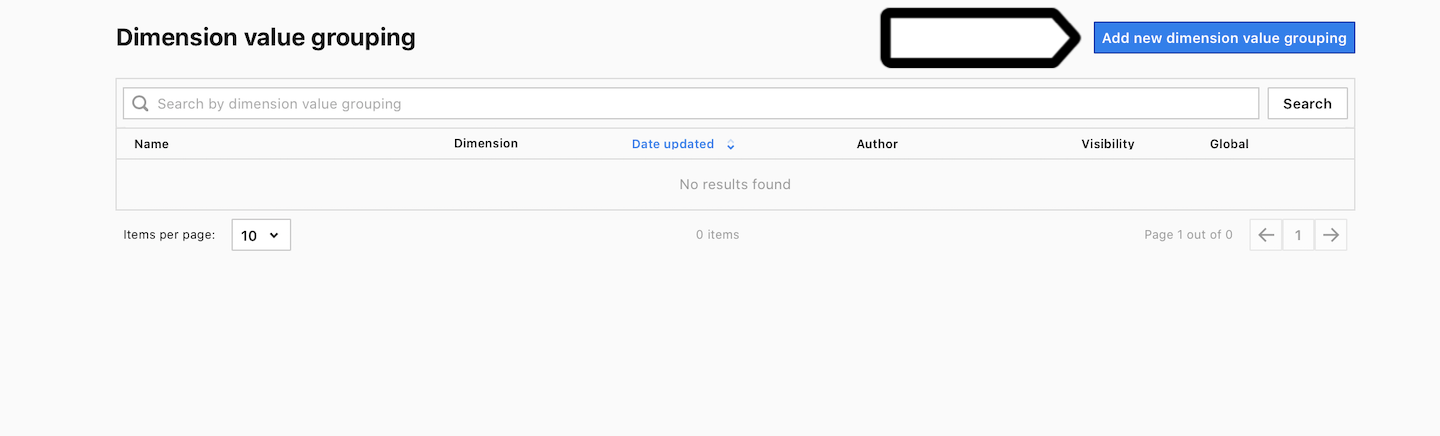
3. On the left, click Dimension value grouping.
4. Click Add a dimension value grouping.
5. Name the dimension value grouping.
6. In Visibility, choose Author or All users. All users lets you share this grouping with your teammates.
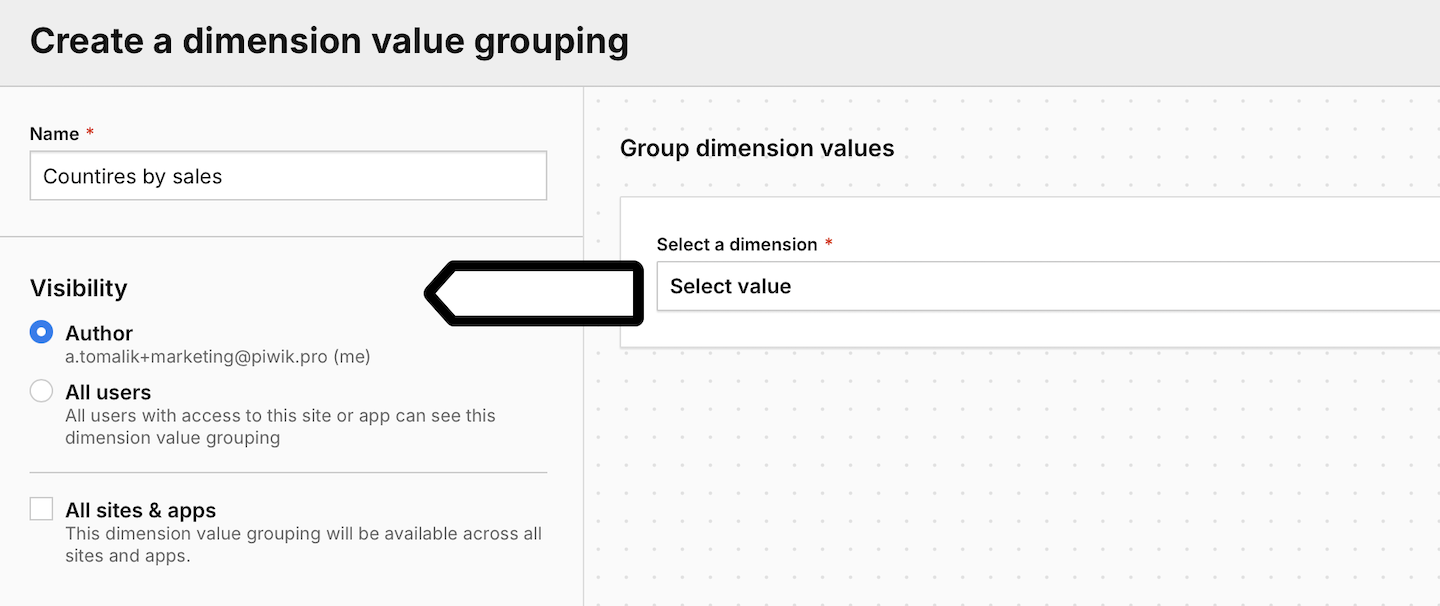
7. (Optional) Check All sites & apps to make this grouping visible across all sites and apps.
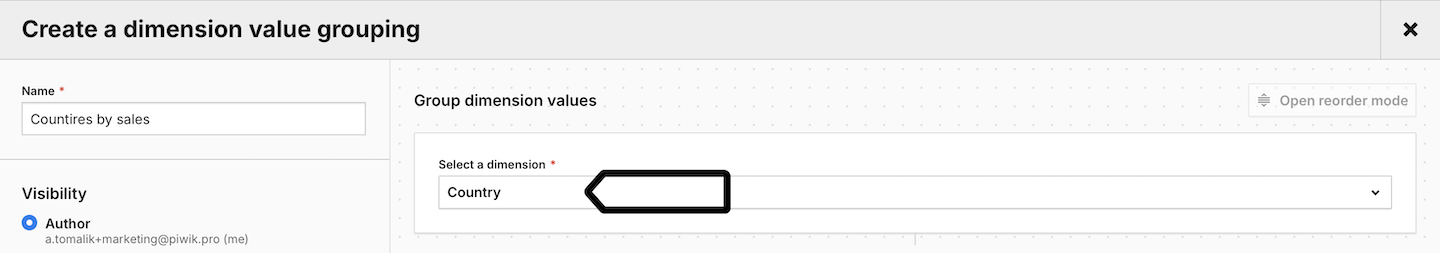
8. Select the dimension that you want to regroup.
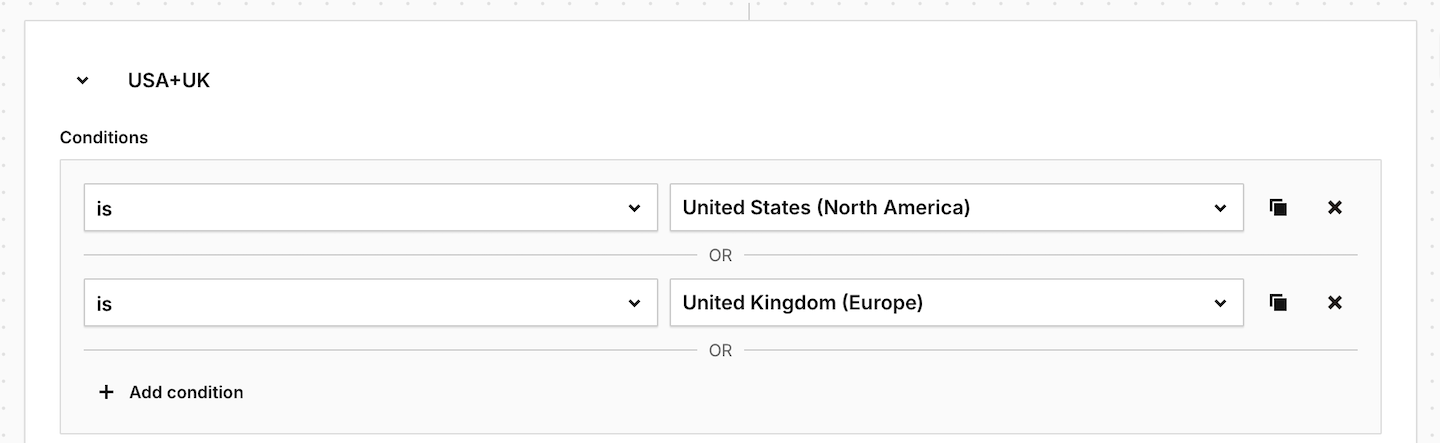
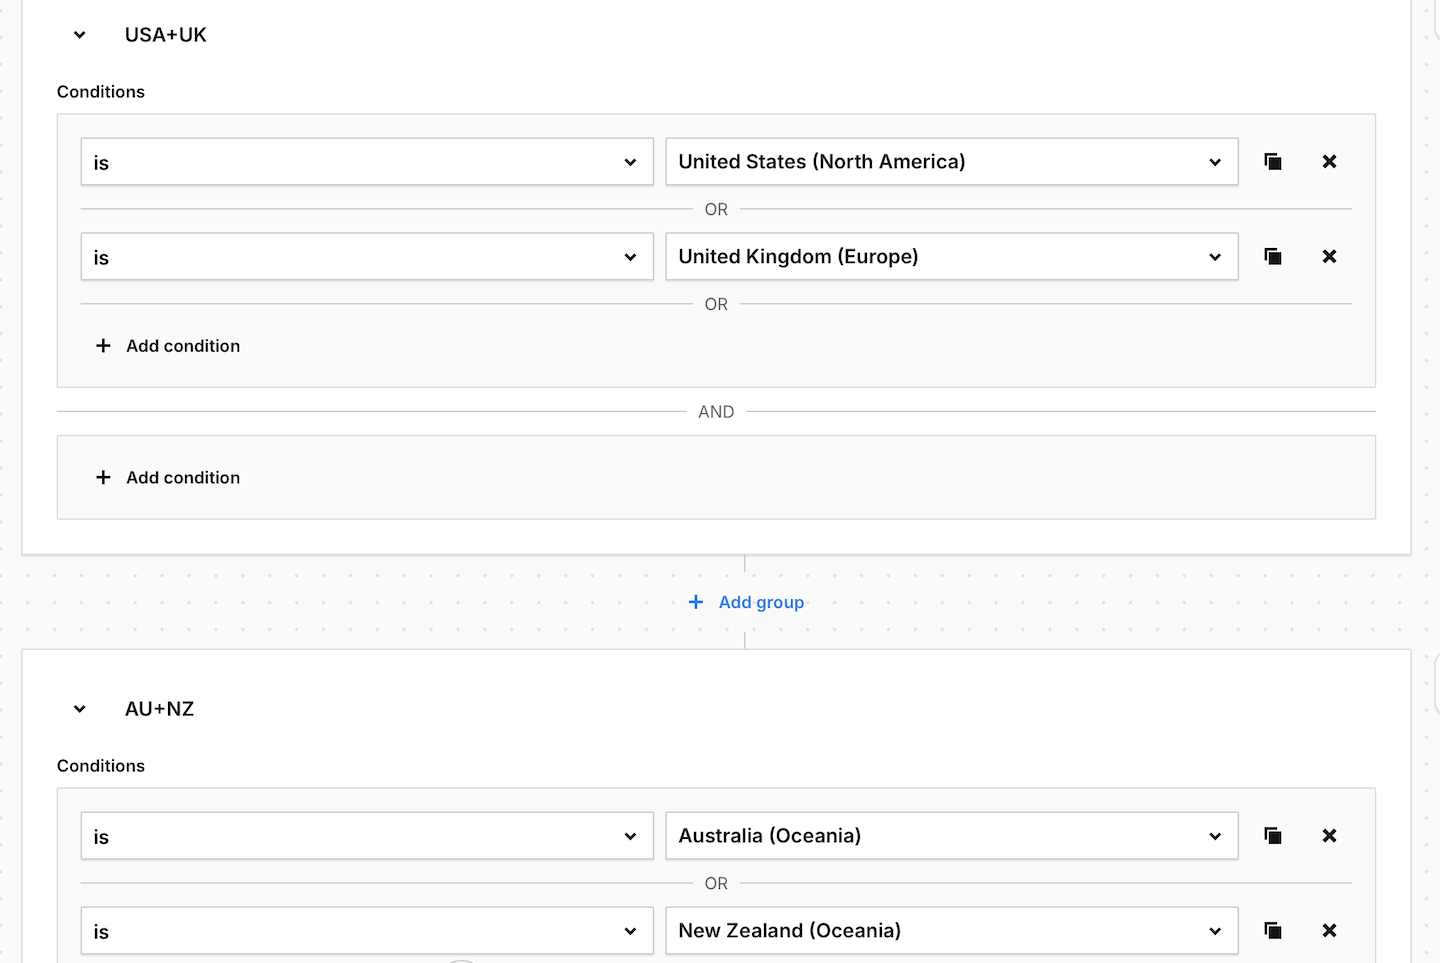
9. Name the first group.
10. Set conditions. Example: Country is United States or Country is United Kingdom.
11. Click + Add group, name the second group and define its conditions.
12. Add more groups.
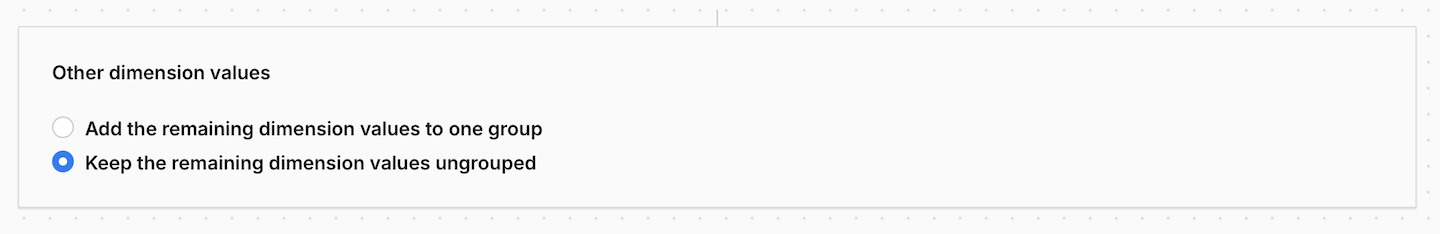
13. In Other dimension values, select how you want to group the remaining values. You can choose from the following options:
- Add the remaining dimension values to one group
- Keep the remaining dimension values ungrouped
14. When you’re done, click Save.
15. Job done! Your new grouping is now available and you can use it in your custom reports and dashboards.
Use custom grouping in custom reports
After you’ve made a new grouping for dimension values, you can use it in custom reports and on dashboards.
To use your custom grouping in custom reports, follow these steps:
1. Go to Menu > Analytics.
2. Navigate to Custom reports.
3. Edit a report or create a new one.
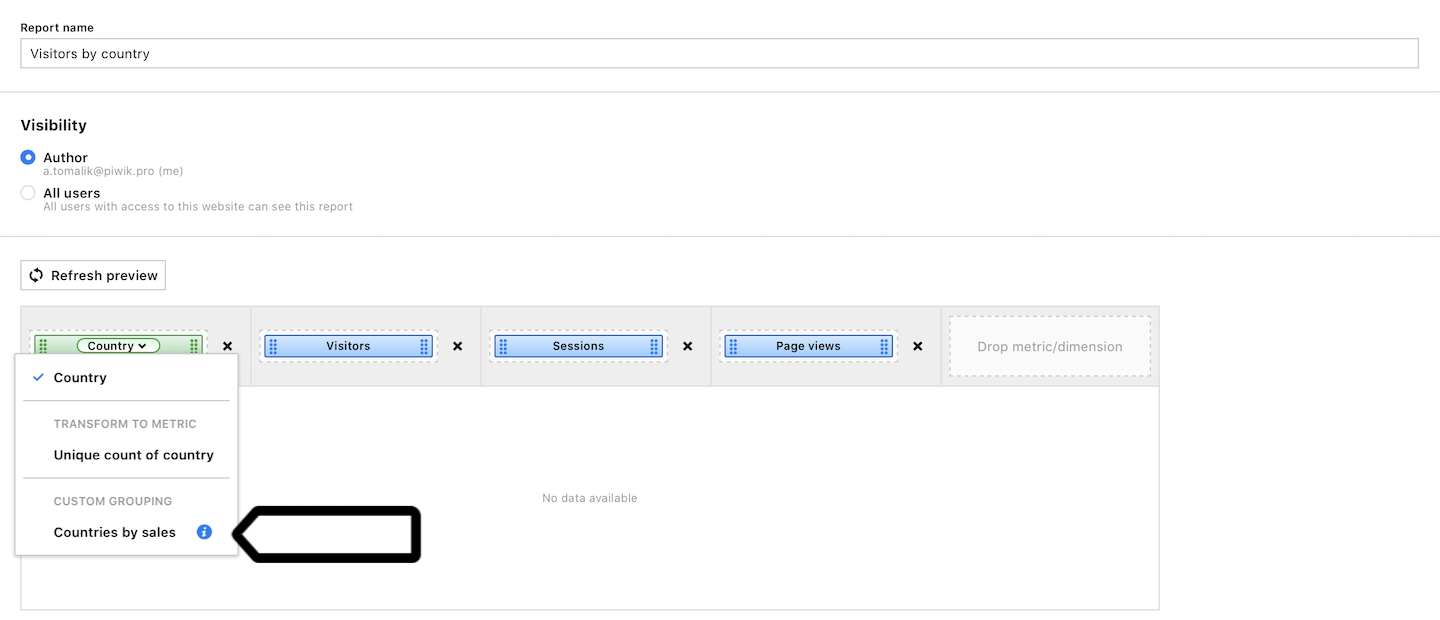
4. When setting up the report, add the dimension with custom grouping.
5. Click the dimension and select your custom grouping.
6. When you’re done, click Save.
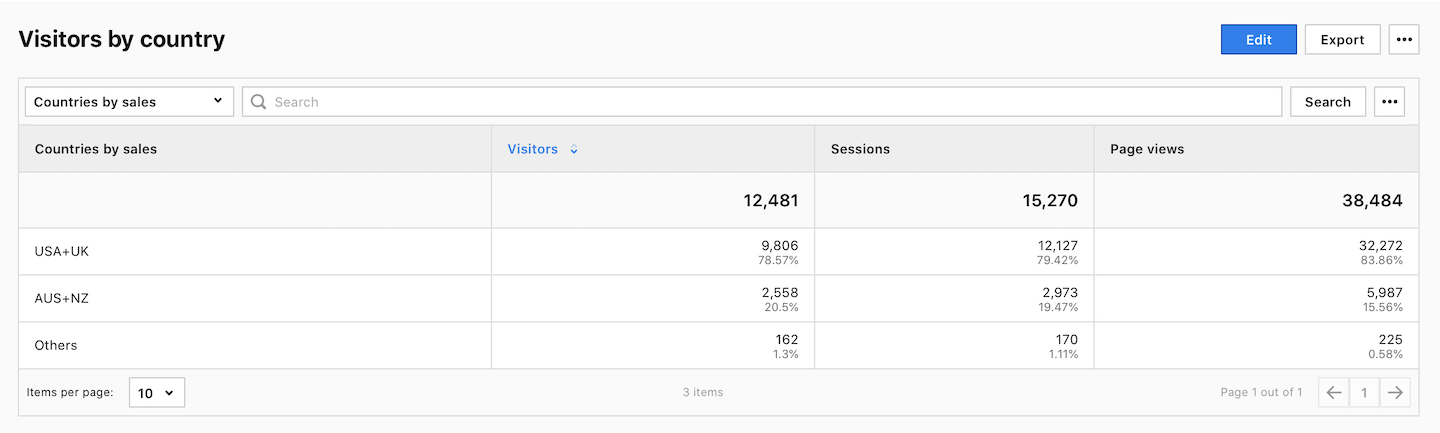
7. All done! Your report will now show data with your custom grouping.
Note: Custom grouping in the user flow report is available for dimensions that apply to this report. You can access it from the list of interaction settings.
Use custom grouping on dashboards
To use your custom grouping on dashboards, follow these steps:
1. Go to Menu > Analytics.
2. Navigate to Dashboards.
3. Edit a widget on the dashboard or add a new dashboard and a new widget.
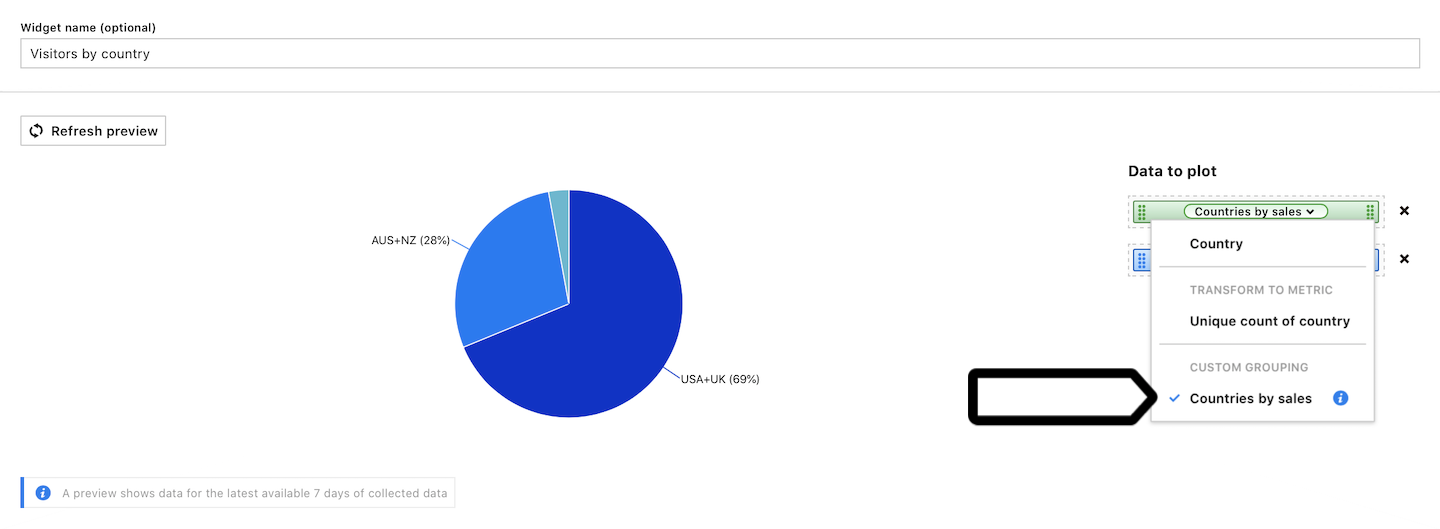
4. When setting up the widget, add the dimension with custom grouping.
5. Click the dimension and select your custom grouping.
6. When you’re done, click Save.
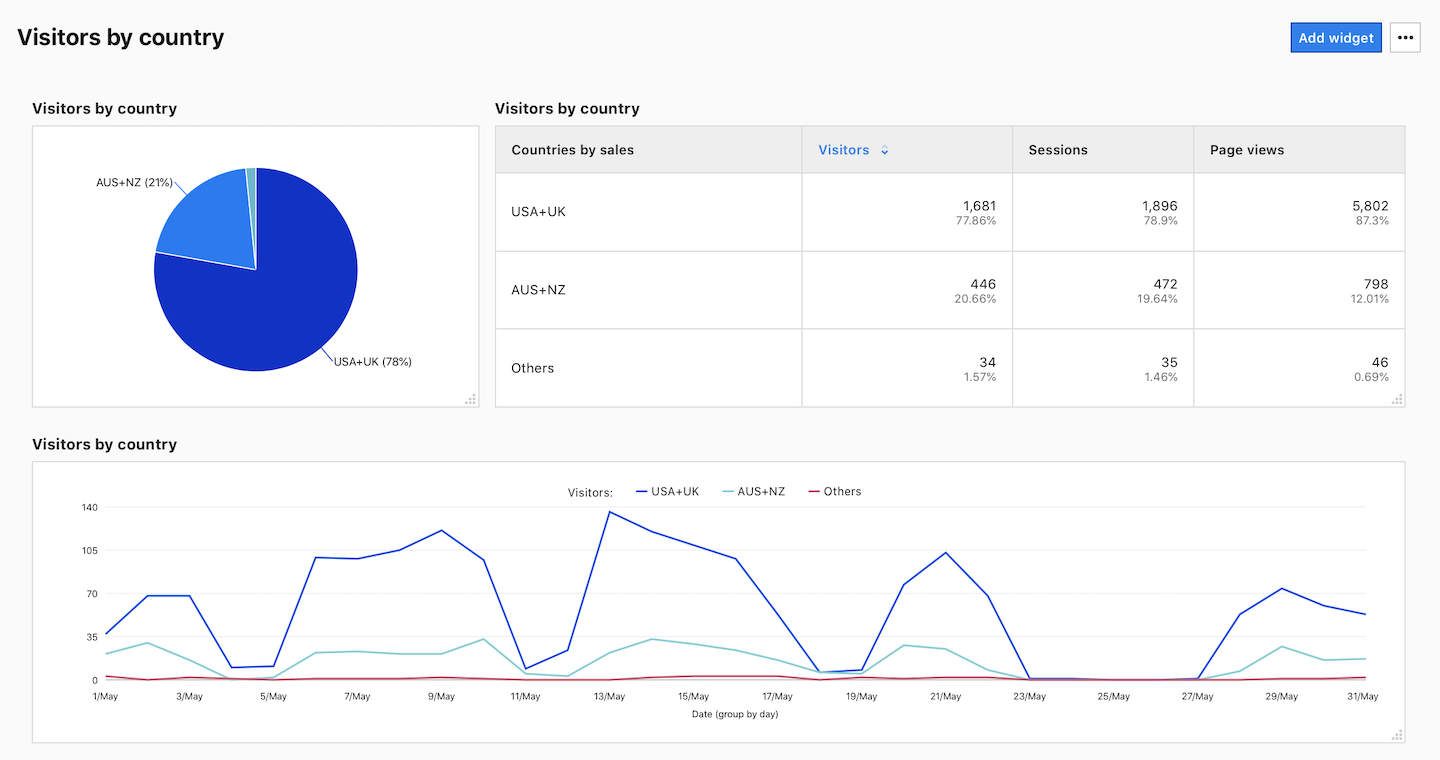
7. Done! The dashboard widget will now show data with your custom grouping.
Edit, copy and delete custom grouping
Whenever you need to change, copy or remove a custom grouping, you can do it with just a few clicks.
To edit, copy or delete a grouping, follow these steps:
1. Go to Menu > Analytics.
2. Navigate to Settings.
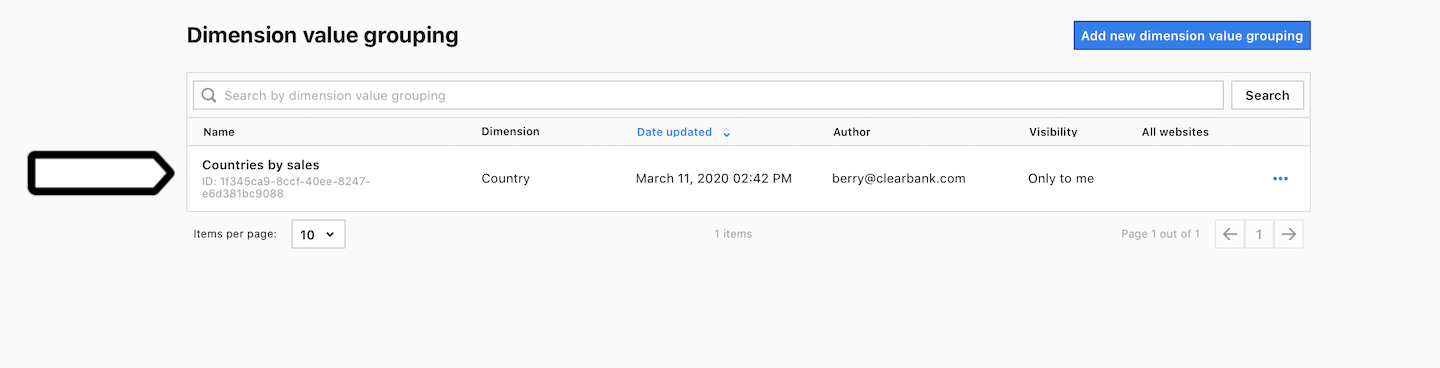
3. On the left, click Dimension value grouping.
4. Select the custom grouping you want to work with.
5. On the right, click the ⋯ three-dot icon.
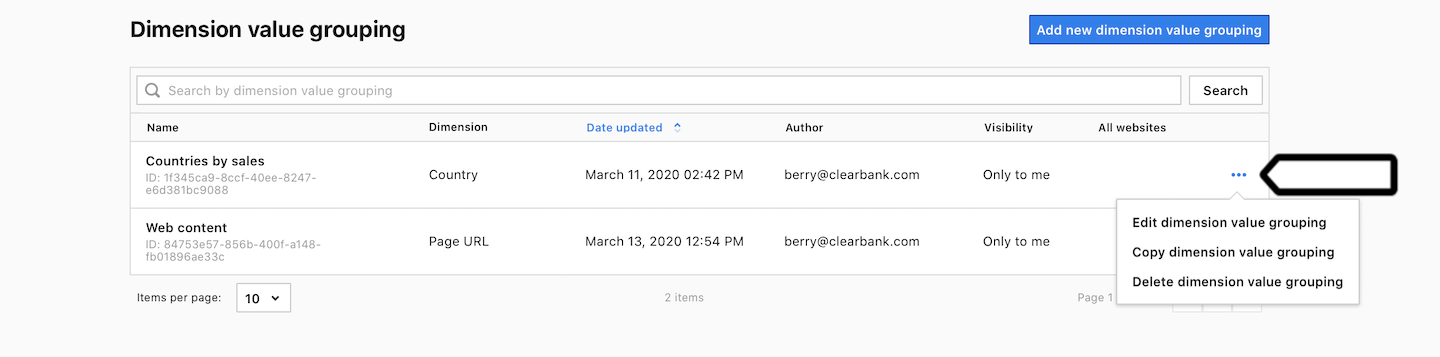
6. Click edit, copy or delete.
7. Follow the steps on the screen.
8. Done!
Custom grouping examples
You can use custom grouping to create a data structure that fits your business or organization. Here are a few examples:
- Organize countries: If your focus is on the US and UK markets, you can group these countries together within a “Sales regions” category.
- Categorize page URLs: Take your website’s page URLs and organize them into content categories. This could include creating groups for product pages, blogs, help center pages and landing pages. This way, you can easily analyze the content on your website.
- Manage referrer URLs: Separate your website’s traffic from external sources by grouping your own websites together and putting other websites in a different category. This helps you keep track of your internal and external traffic separately.