Dimensions are like the characteristics or traits of data, and you can think of them as the who, what, when and where. For example, a page title or the source of website traffic (like “Google” or “Facebook”) are dimensions. They help organize and categorize data.
Metrics, on the other hand, are all about the numbers. They provide quantitative information. Metrics are like the “how much” or “how well” of your data. Examples include the number of page views, the bounce rate (the percentage of visitors who leave a webpage without interacting) or the cost of a Google Ads campaign. Metrics give you measurable insights into what’s happening with your data.
In a nutshell, dimensions describe and categorize, while metrics quantify and provide numerical details. Together, they help you understand and analyze data effectively.
About event, session and product scope
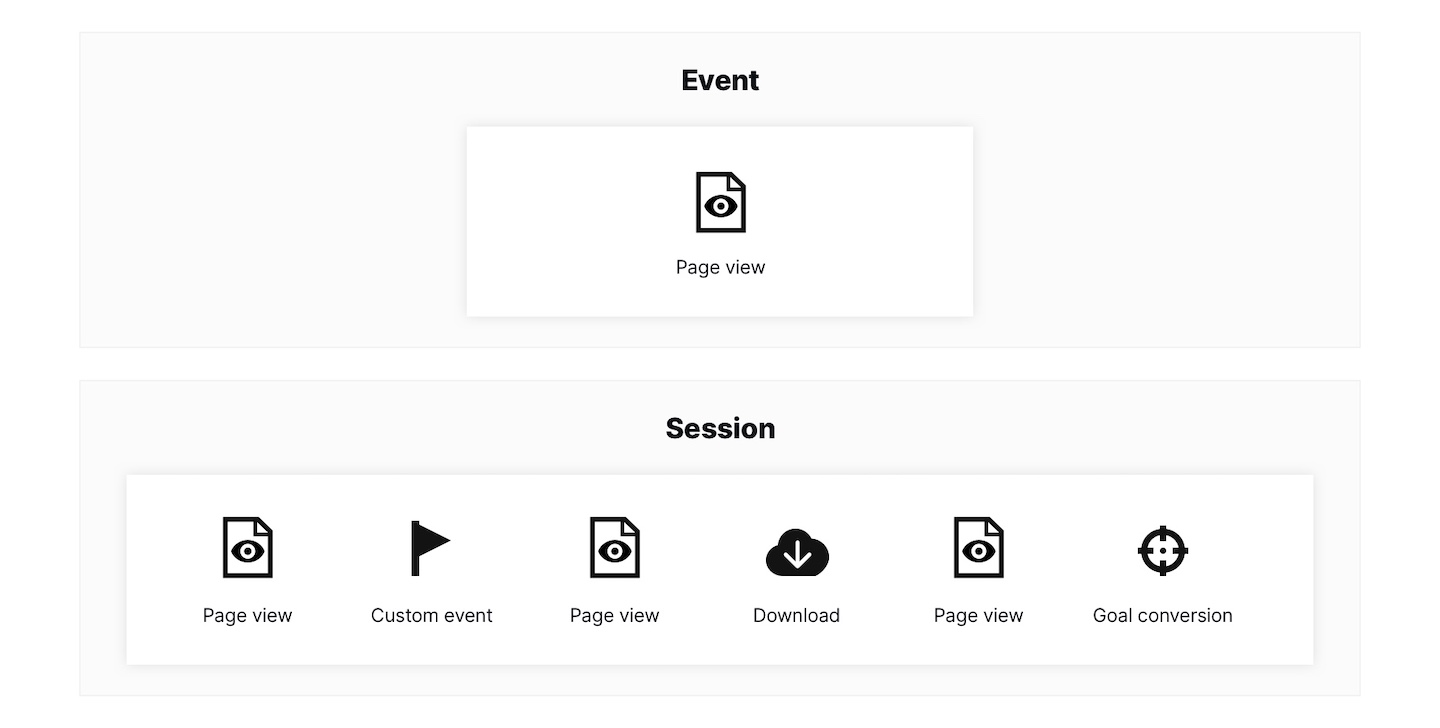
Dimensions and metrics can belong to event scope, session scope or product scope. Event scope refers to individual interactions within a session, as shown in the image below. For example, dimensions like page URL or search keyword, along with metrics like page views and searches, fall under event scope. On the other hand, session scope includes all events during an entire visit, including dimensions such as campaign or device type and metrics like sessions and bounce rate. Product scope relates specifically to dimensions and metrics associated with ecommerce product tracking.
Note: Some dimensions and metrics can’t be combined due to conflicting scopes. Read more
How reports are calculated
Now, let’s dive into how we calculate data for a report. This will give you a better grasp of dimensions, metrics and scopes.
Take a look at some real events on the Clear Bank website.
| Event type | Page URL (path) | Device type | Goal name | Goal revenue | |
|---|---|---|---|---|---|
| Event 1 | Goal conversion | /product-tour/ | Desktop | App signup | $50 |
| Event 2 | Site search | /help/ | Mobile | – | – |
| Event 3 | Page view | /blog/ | Mobile | – | – |
| Event 4 | Goal conversion | /blog/ | Desktop | Newsletter signup | $5 |
In the top row of this example, everything you see is a dimension: event type, page URL (path), device type, goal name and goal revenue.
If we were to create reports and crunch some numbers, they would look like this.
Example 1
| Page URL (path) | Events | Goal conversion | Sum of goal revenue |
|---|---|---|---|
| /product-tour/ | 1 | 1 | $50 |
| /help/ | 1 | 0 | 0 |
| /blog/ | 2 | 1 | $5 |
In this example, page URL (path) is a dimension, while events, goal conversion and the sum of goal revenue are metrics.
Example 2
| Device type | Events | Goal conversion | Sum of goal revenue |
|---|---|---|---|
| Desktop | 2 | 2 | $55 |
| Mobile | 2 | 0 | 0 |
In this example, device type serves as a dimension, while events, goal conversion and the sum of goal revenue are metrics.
Note: Sometimes you may notice differences when you’re comparing your reports or widgets. Read more about it in this article.