In Piwik PRO, you have access to a wide range of valuable metrics to analyze your website’s traffic and visitor behavior. However, there may be times when you need a unique metric that’s specific to your business. In such cases, you can create a brand-new metric.
To create a calculated metric, follow these steps:
1. Go to Menu > Analytics.
2. Navigate to Settings.
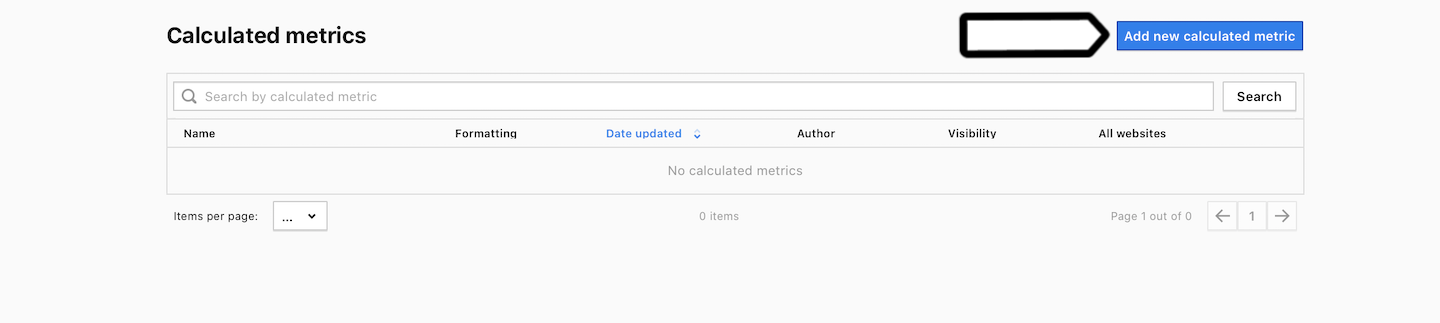
3. On the left, click Calculated metrics.
4. Click Add a calculated metric.
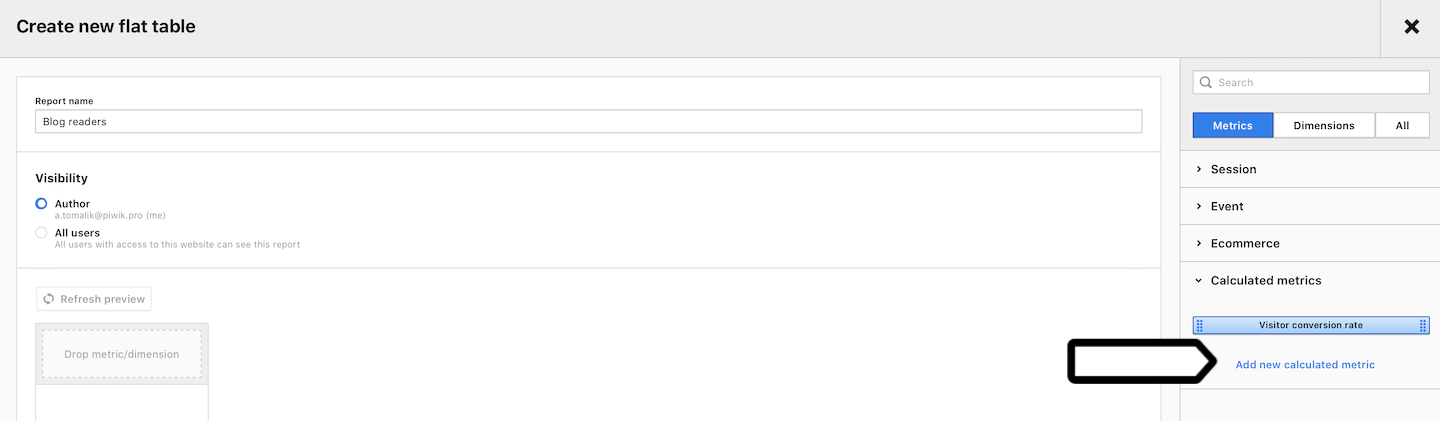
5. You can also skip steps 1-4. In a custom report, click Create a calculated metric.
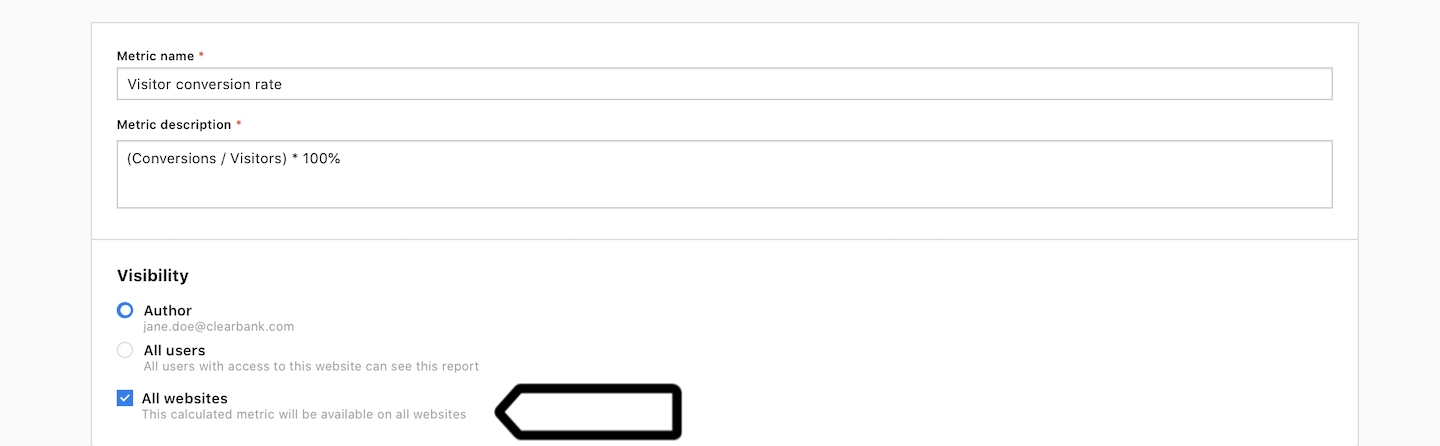
6. Name the calculated metric and add a description.
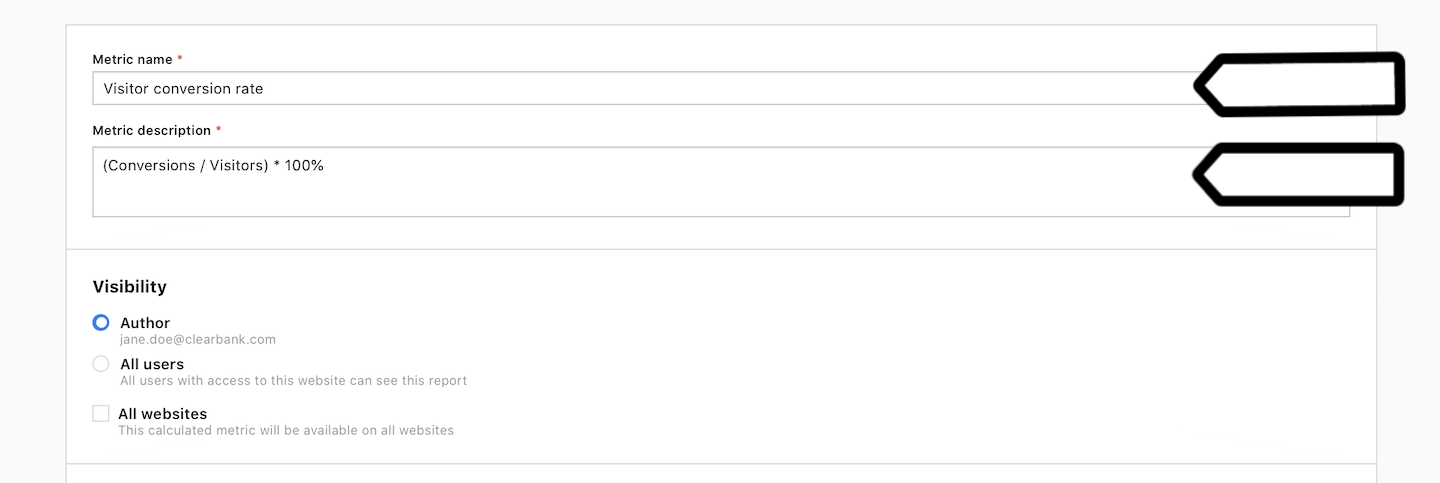
Tip: The added description will appear in the metric tooltip.
7. In Visibility, choose Author or All users. All users lets you share this dashboard with your teammates.
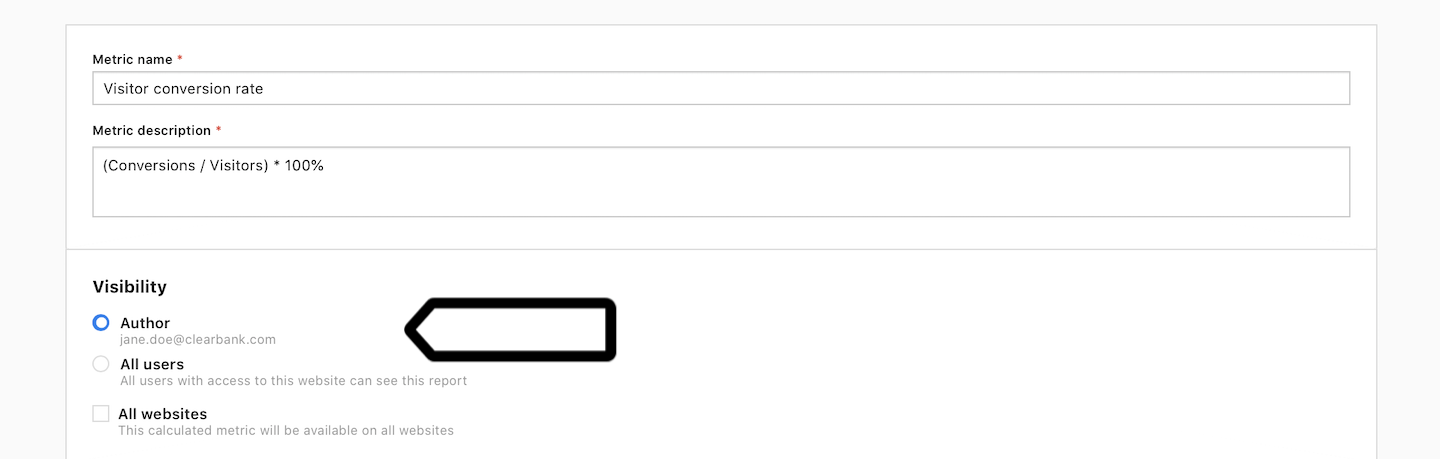
8. (Optional) Check All sites & apps to make this dashboard visible across all sites and apps.
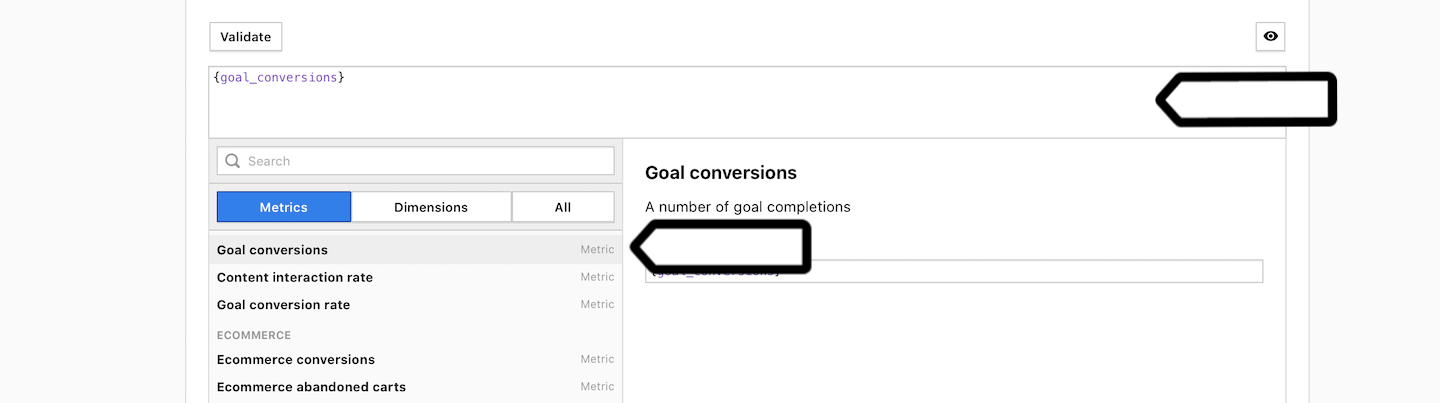
9. Add a formula for your calculated metric using existing metrics from the list. You can use the following operators: +, -, / and *.
10. The list also includes dimensions that can be converted to metrics. Click a dimension to see the available metrics.
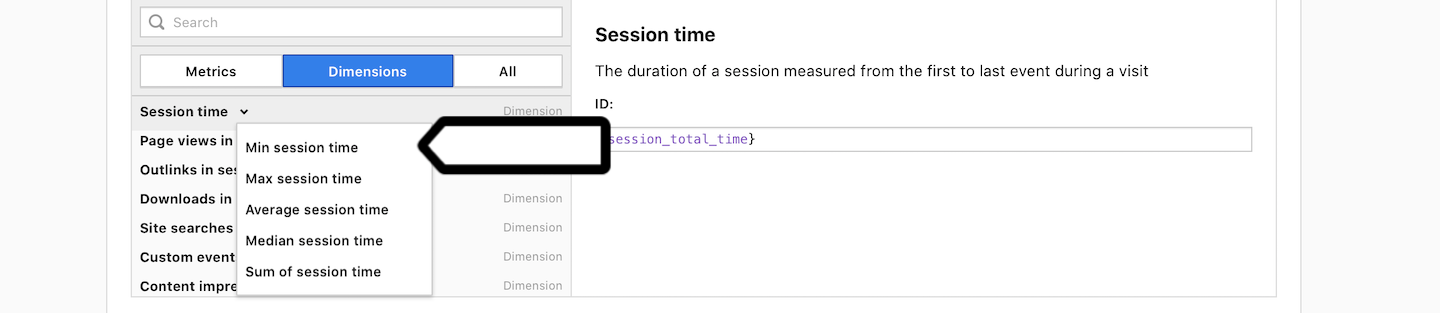
Note: Only the listed transformations are available. It’s not yet possible to use your own transformations.
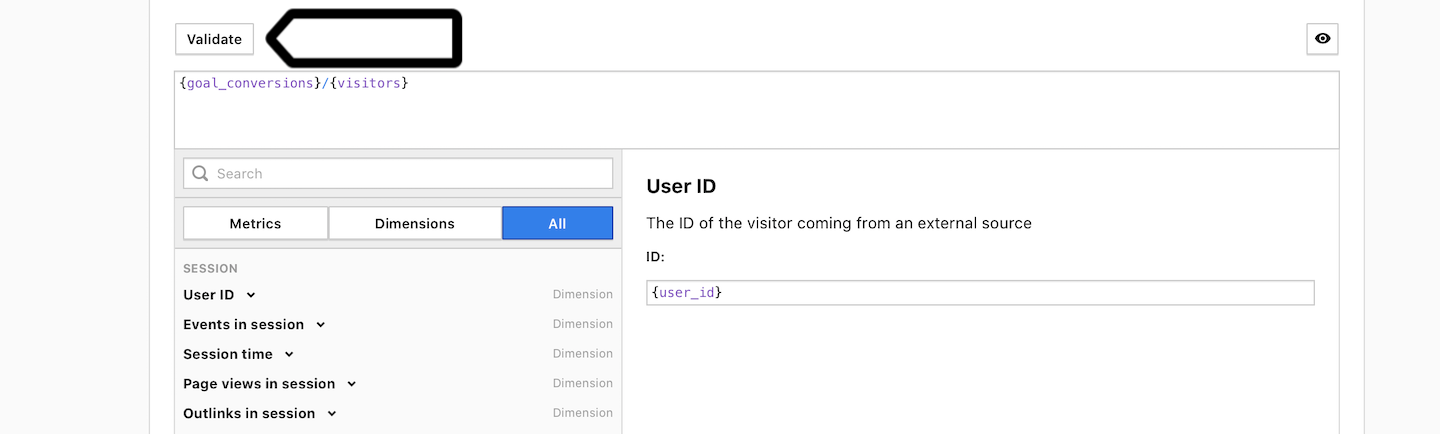
11. Once the formula is ready, click Validate to verify that the new metric is calculated correctly.
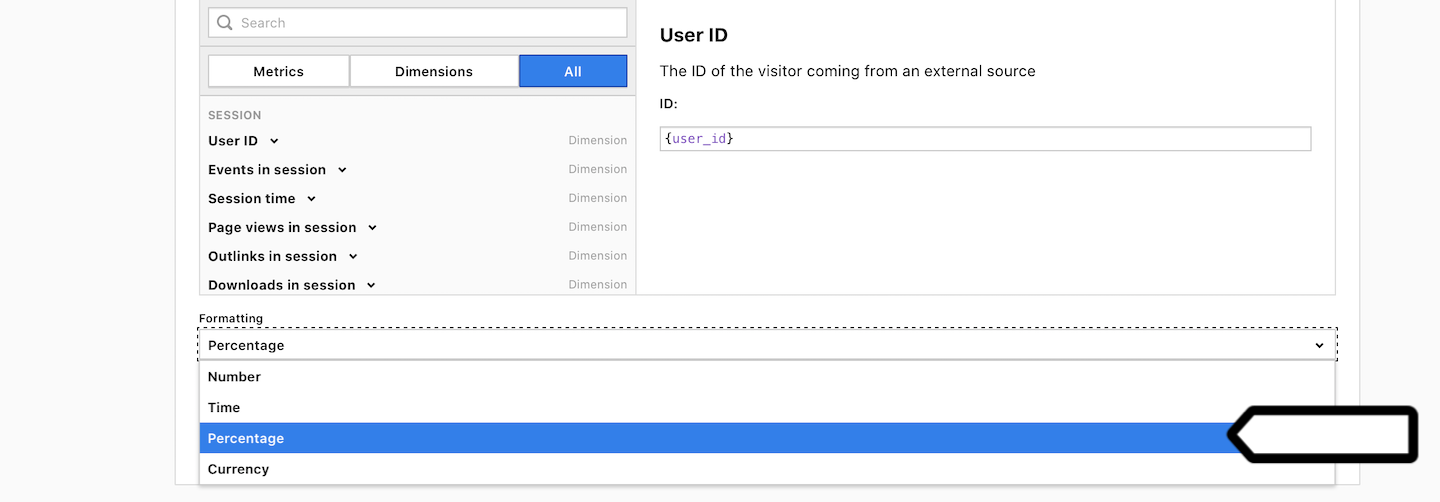
12. In Formatting, select a formatting type for the new metric.
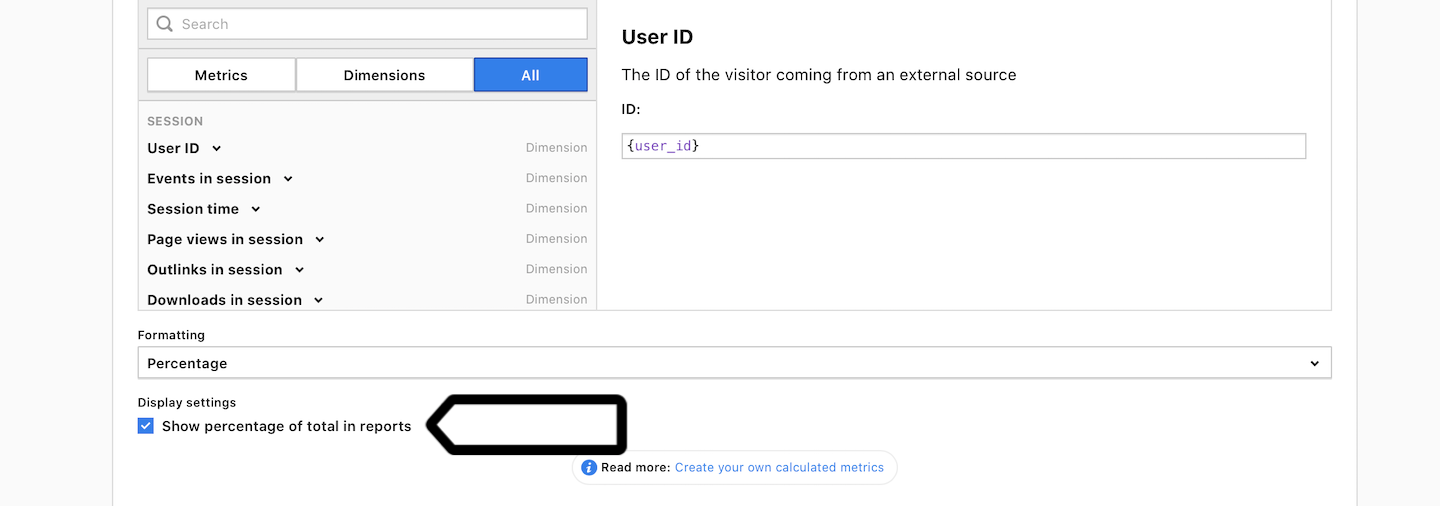
13. (Optional) In Display settings, choose whether to show or hide the percentage of the total in reports.
14. When you’re done, click Create.
15. Job done! You can now use your brand-new metric in custom reports and dashboards.
Use a calculated metric in custom reports
After you create a calculated metric, you can use it in custom reports and dashboards. You won’t find calculated metrics in core reports because they come with default metrics. However, you can always customize a core report and then include calculated metrics.
To use calculated metrics in custom reports, follow these steps:
1. Go to Menu > Analytics.
2. Navigate to Custom reports.
3. Click Add a report.
4. Select a report type.
5. Name the report.
6. On the right, click Metrics > Calculated metrics.
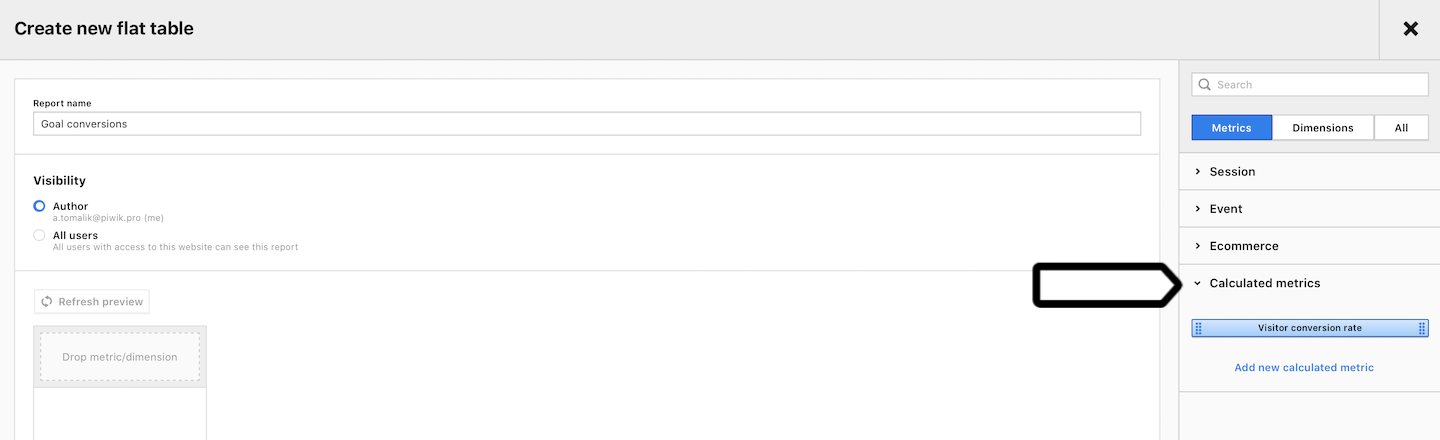
7. Build your new report using calculated metrics and other dimensions and metrics.
8. When you’re done, click Save.
9. All done!
Use a calculated metric on dashboards
To use calculated metrics on dashboards, follow these steps:
1. Go to Menu > Analytics.
2. Navigate to Dashboards.
3. Click Add a dashboard.
4. Name the dashboard.
5. In Visibility, choose Author or All users. All users lets you share this dashboard with your teammates.
6. Click Add widget and select the type you want.
7. On the right, click Metrics > Calculated metrics.
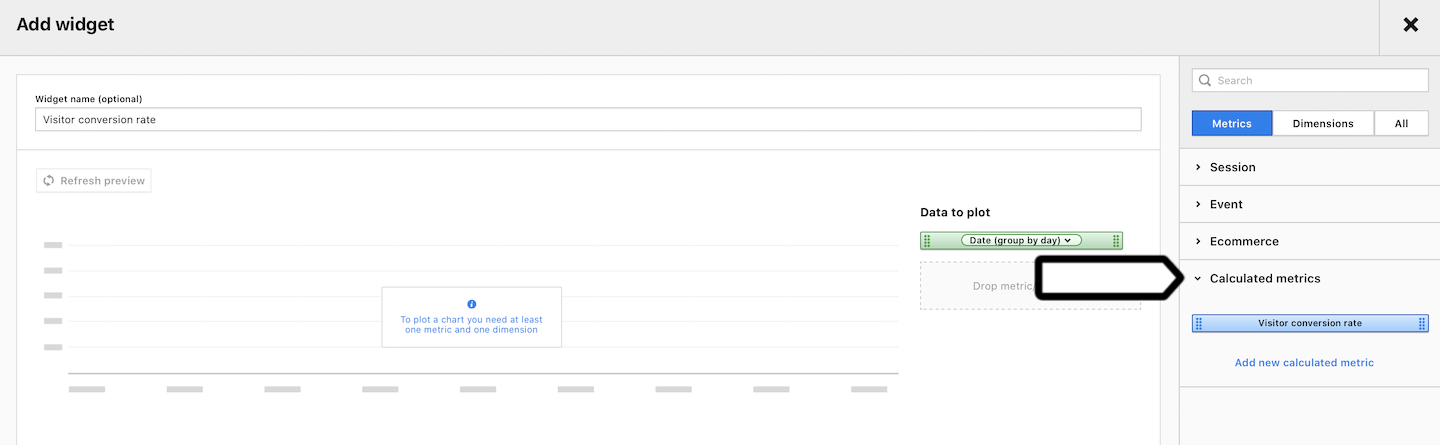
8. Set up the widget using calculated metrics and other dimensions and metrics.
9. When you’re done, click Save.
10. Add more widgets to your dashboard.
11. Done!
Edit, copy or delete a calculated metric
To edit, copy or delete a calculated metric, follow these steps:
1. Go to Menu > Analytics.
2. Navigate to Settings.
3. On the left, click Calculated metrics.
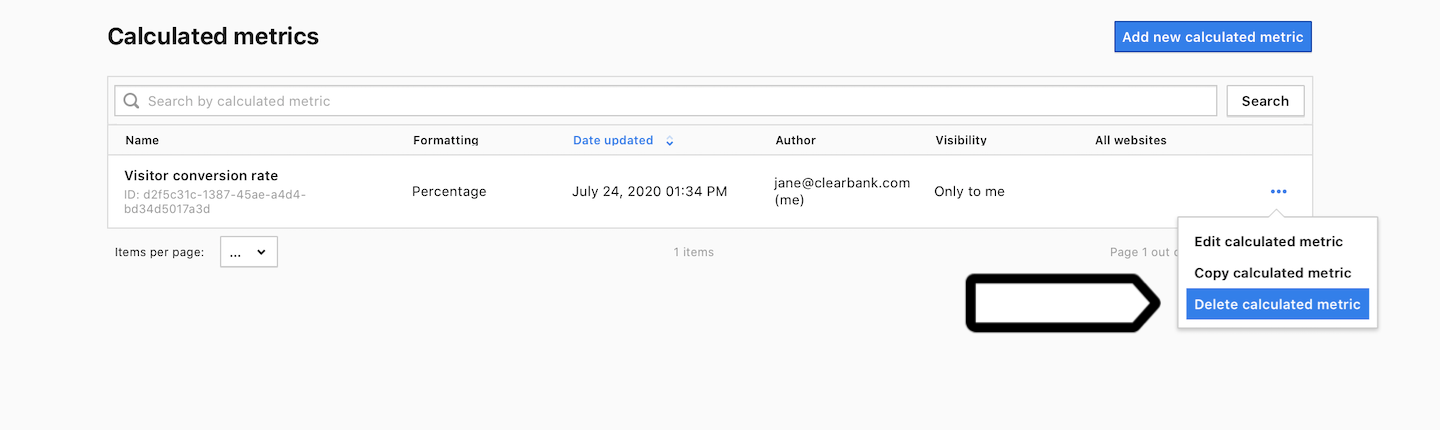
4. Select the metric you want to work with.
5. On the right, click the ⋯ three-dot icon.
6. Click Edit calculated metric, Copy calculated metric or Delete calculated metric.
7. Done!
Examples of calculated metrics
Calculated metrics offer you the freedom to craft a metric that precisely reflects the traffic on your website. However, if you’re in need of some inspiration before diving in, here’s a list of examples that can be quite useful for your web reporting.
Pages per visitor: This metric is similar to the default metric "Page views in session." It indicates the average number of pages viewed by a visitor on your website.
Name: Pages/Visitors
Formatting: Number
Formula: {page_views} / {visitors}
Sessions per visitor: This metric illustrates the average number of sessions that a visitor had on your website.
Name: Sessions/Visitors
Formatting: Number
Formula: {sessions} / {visitors}
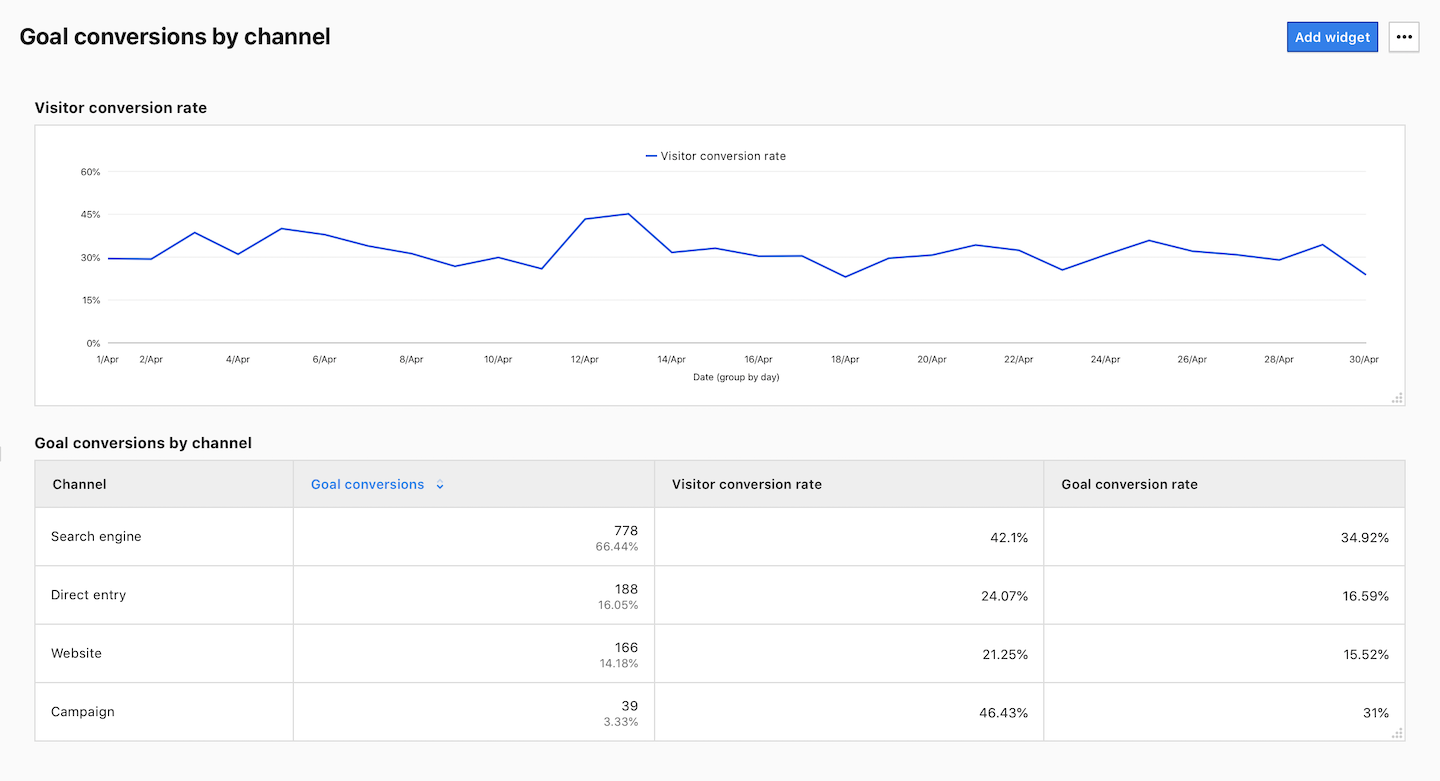
Visitor conversion rate: This metric provides a clearer perspective on the website’s conversion rate, focusing on visitors rather than sessions.
Name: Visitor conversion rate
Formatting: Percentage
Formula: {goal_conversions} / {visitors}
Visitor order rate: This metric emphasizes order data based on visitors, not sessions.
Name: Visitor order rate
Formatting: Percentage.
Formula: {ecommerce_conversions} / {visitors}
Total visitor conversion rate: This metric merges goal conversions and orders to present a comprehensive conversion rate based on visitors.
Name: Total visitor conversion rate
Formatting: Percentage
Formula: ({goal_conversions} + {ecommerce_conversions}) / {visitors}
No-bounces: This metric is the opposite of the default "Bounces" metric. It enables you to concentrate on traffic that remained engaged after the first-page view.
Name: No-bounces
Formatting: Number
Formula: {sessions} – {bounces}
No-bounce rate: This metric reveals the percentage of sessions that involved more than one-page view.
Name: No-bounces
Formatting: Percentage
Formula: ({sessions} – {bounces}) / {sessions}