You may sometimes see different values for the same metric in reports or widgets. This happens because the metric is calculated in a different scope: session or event.
In this example, you can see how metrics are counted in different scopes:
| Metric | In sessions scope | In events scope |
|---|---|---|
| Events | Sum of all events in the session | Count of all event rows |
| Sessions | Count of all session rows | Count of unique session_id values (approximation) |
| Goal conversions | Sum of all goal conversions in the session | Count of all rows where event type is Goal conversion |
| Goal conversions (for a specific goal) | Not available | Count of all rows where event type is Goal conversion and goal ID is a chosen goal |
Note: If you look at events in a sessions-based report, you’ll see how many events happened during the session. But in an events-based report, you’ll see the total number of events (every row).
Read more about dimensions and metrics, or see why some of them can’t be combined.
Here are the main reasons why reports can show slightly different values:
1. Sessions that span midnight:
A session that starts before midnight can include events from the next day. For example, a session from Feb 10, 2025 may include events that happened on Feb 11, 2025. That’s why the same metric can show different counts in daily reports.
Example:
Events:
| Session ID | Session server time | Server time | Page URL | Events in session |
|---|---|---|---|---|
| 1 | 2025-02-10T22:00:00 | 2025-02-10T22:00:00 | /blog/ | 2 |
| 1 | 2025-02-10T22:00:00 | 2025-02-10T22:02:15 | /exit-page/ | 2 |
| 2 | 2025-02-10T23:51:23 | 2025-02-10T23:51:23 | / | 3 |
| 2 | 2025-02-10T23:51:23 | 2025-02-10T23:57:02 | /blog/ | 3 |
| 2 | 2025-02-10T23:51:23 | 2025-02-11T00:01:00 | /purchase/ | 3 |
| 3 | 2025-02-11T00:12:23 | 2025-02-11T00:12:23 | / | 1 |
Sessions:
| Session ID | Server time | Events in session |
|---|---|---|
| 1 | 2025-02-10T22:00:00 | 2 |
| 2 | 2025-02-10T23:51:23 | 3 |
| 3 | 2025-02-11T00:12:23 | 1 |
Report #1: date range: 2025-02-10 – 2025-02-11; scope: session; filters: none
| Date (group by day) | Sessions | Events |
|---|---|---|
| 2 | 5 | |
| 1 | 1 |
Report #2: date range: 2025-02-10 – 2025-02-11; scope: event; filters: event_url != “abc”
| Date (group by day) | Sessions | Events |
|---|---|---|
| 2 | 4 | |
| 2 | 2 |
2. Approximation:
Some operations (like counting unique session IDs in event scope) are resource-intensive. In those cases, we use an approximation method. The difference is usually very small (less than 2%).
How to check the differences
Before comparing the same metric across your reports or widgets, always make sure that it’s calculated in the same scope, with the same filters, and within the same segment. Otherwise, small differences in numbers are normal. In this section, we’ll show you how to check it.
Check if the compared metrics are calculated in the same scope
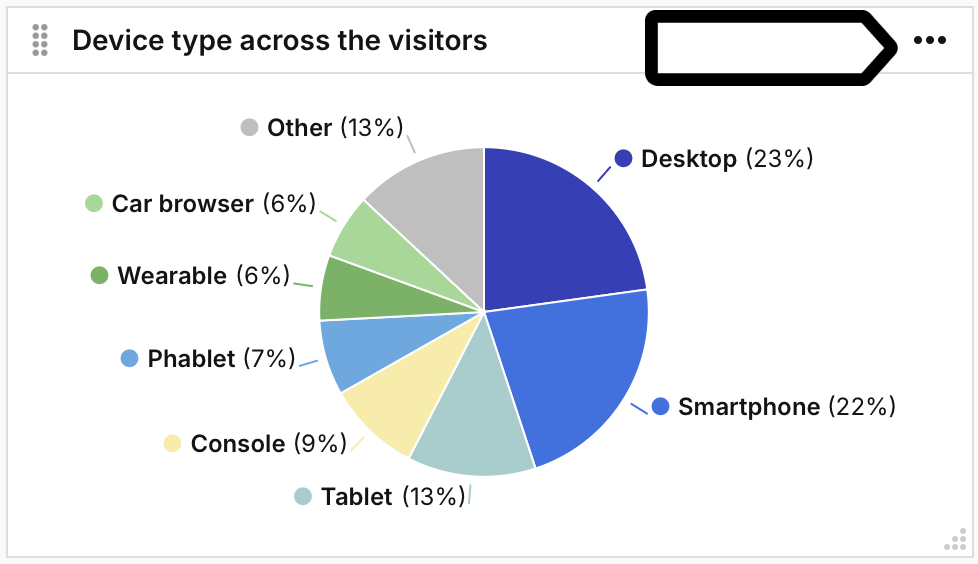
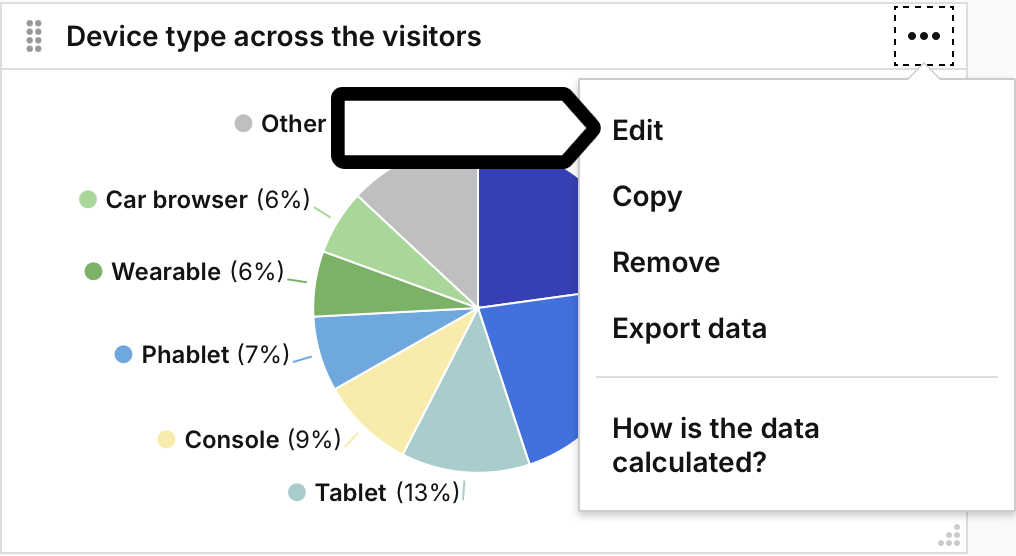
1. Click the ⋯ three-dot icon next to the widget or report.
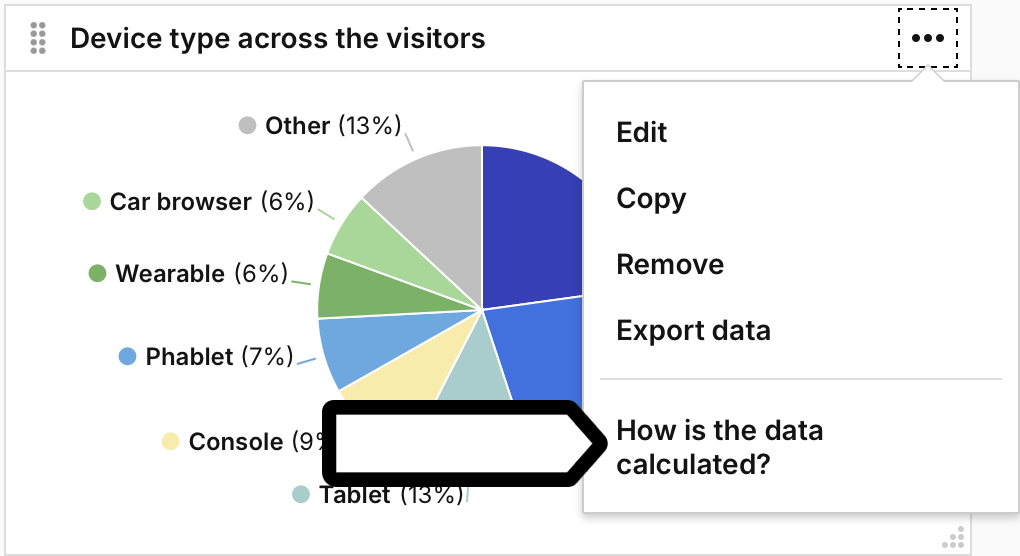
2. Click How is the data calculated? on the list.
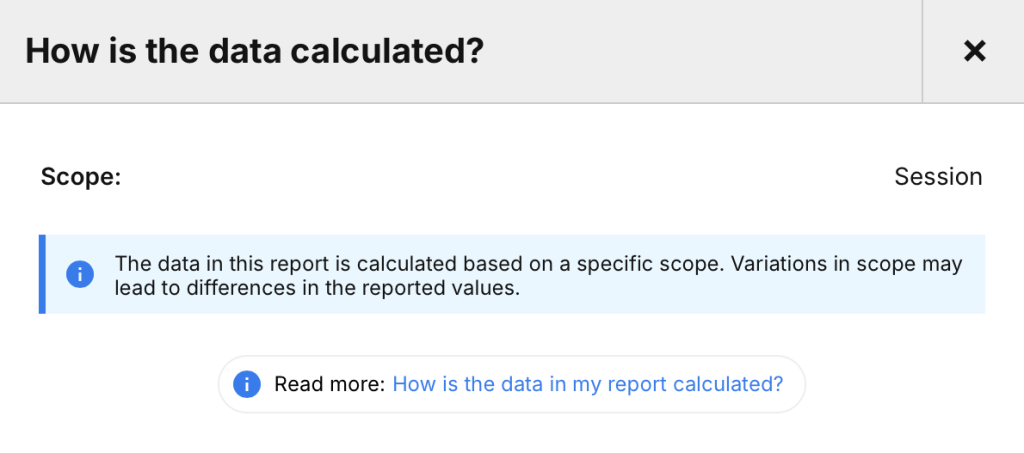
3. You’ll see a description of how we calculate the report or widget. In our example, it’s calculated based on a session scope.
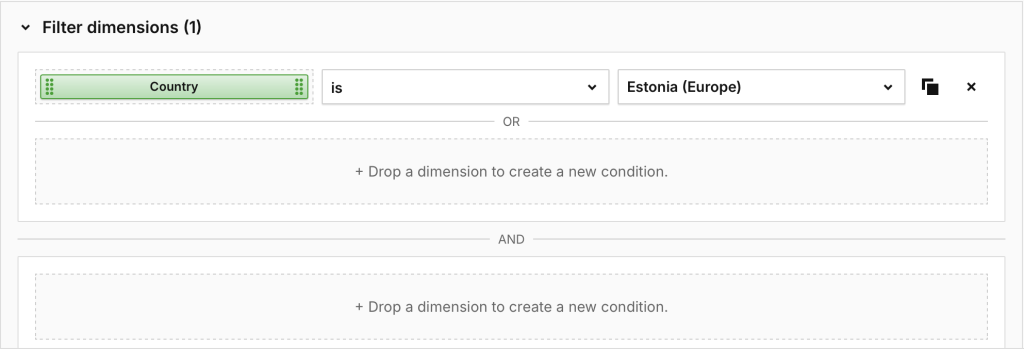
Check if the compared widgets or reports have the same filters applied
1. Click the ⋯ three-dot icon next to the widget or report.

2. Click Edit.
3. Check if there are any additional filters applied in the widget or report. In our example, the filter is set to show only visitors from Estonia.
Check if the compared reports or widgets are in the same segments
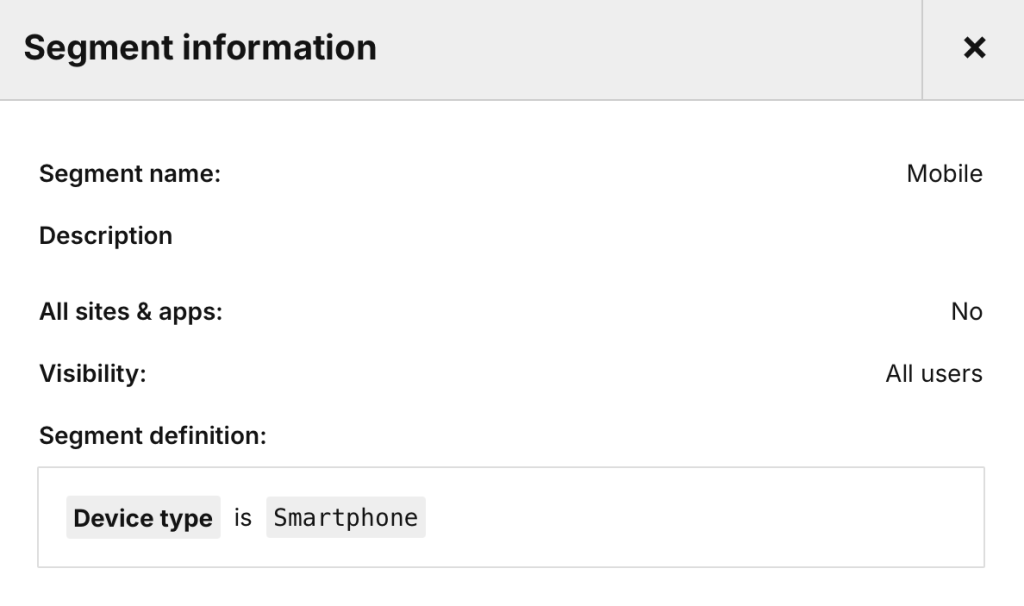
1. If you want to check the segment’s details, click the info icon next to its name.

2. You’ll see more information about the segment. In our example, the segment is set to show only the users who viewed our site or app using a smartphone.
