There are days when it feels like you’re drowning in web data and jumping from one report to the next in the hope of stumbling upon what you need. It’s no fun at all. But don’t worry, there’s a way to always have the necessary data to hand by placing it on dashboards.
You can create dedicated dashboards for individual teams, such as marketing, product or HR. You can also create them for different parts of your website, like your blog, help center or careers page. But you can also organize your data in other ways.
In this article, we’ll show you how to create and use dashboards.
Create a dashboard
To build a dashboard, follow these steps:
1. Go to Menu > Analytics.
2. Navigate to Dashboards.
3. On the left, click Add a dashboard.
4. Under Location, choose the folder where you want to create the dashboard.
Note: You can use folders to organize your dashboards, goals and custom reports. Create shared or private folders directly in the UI – no setup needed.
5. Name the dashboard.
6. (Optional) Add a description for your dashboard.
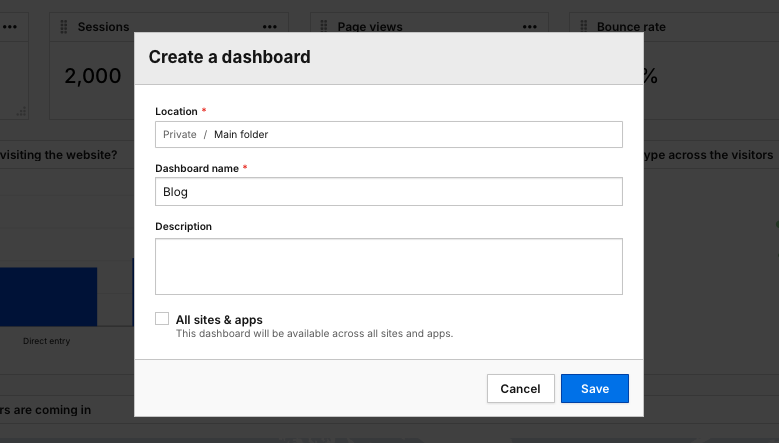
7. (Optional) Check All sites & apps to make this dashboard visible across all sites and apps.
8. Click Save.
9. On the right, click Add a widget and choose one of the following types: Line chart, Bar chart, Pie chart, Table, Counter, Text or Map.
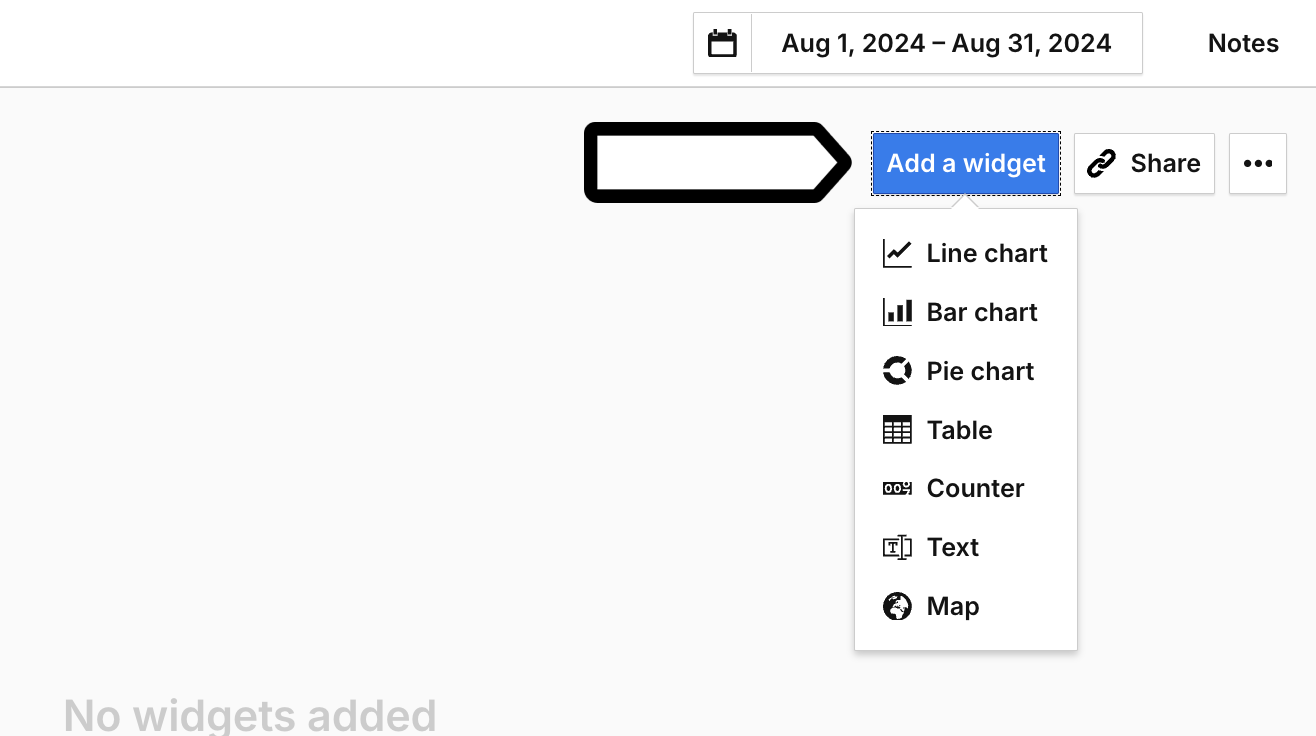
Note: Text and map widgets are available from version 16.4.0 onwards.
10. Name the widget.
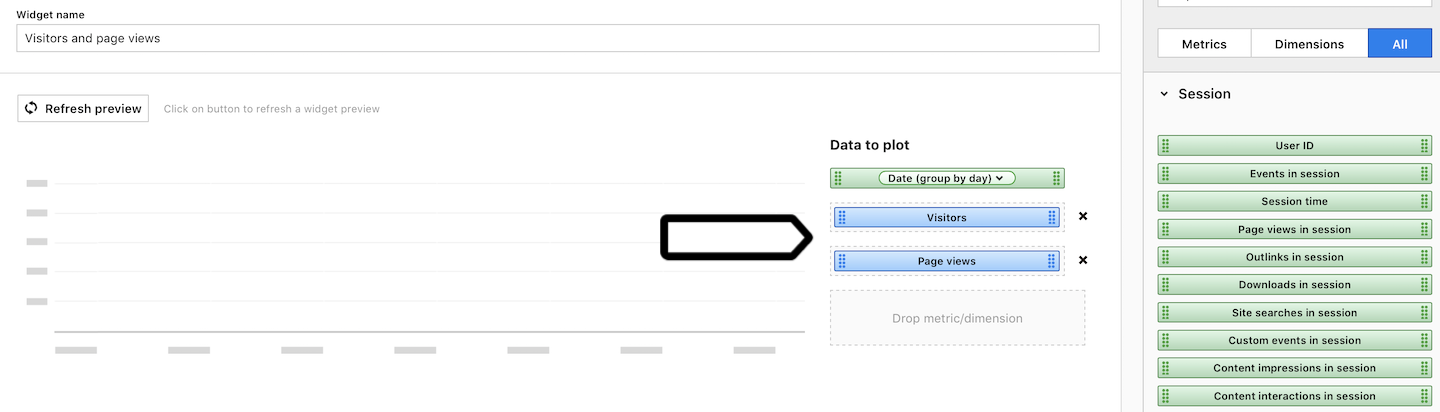
11. On the right, select the data you want to see on the dashboard. Depending on the type of widget, you can either select metrics or a combination of metrics and dimensions.
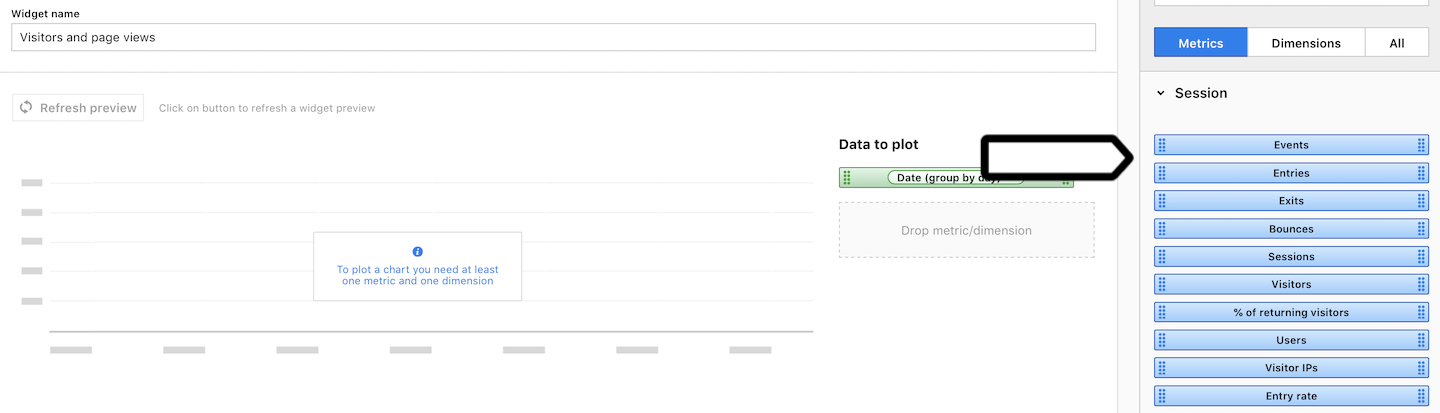
12. Drag and drop the data into the designing space.
Note: For a table widget, you can set default sorting options. This makes the data appear in the report in a specific order based on the selected dimension or metric.
13. (Optional) Apply filters to dimensions or metrics. For example, if we only want to see data from our blog, we can apply the following filter: Page URL contains blog.
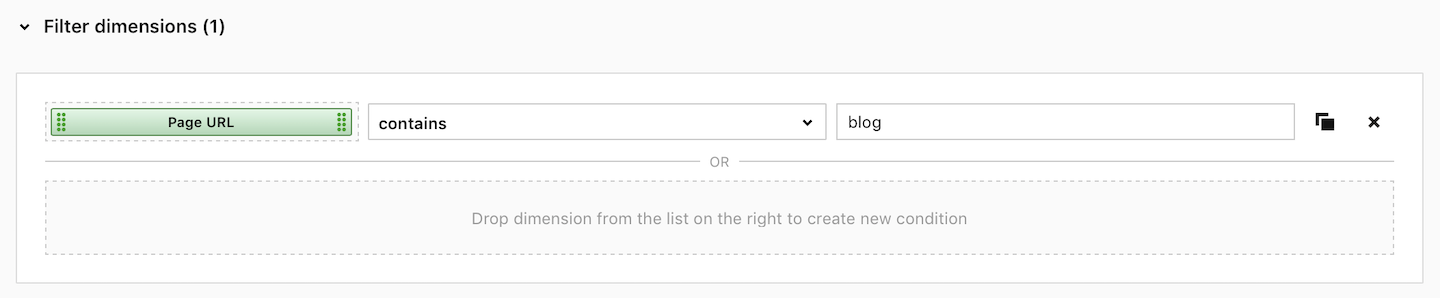
Note: Our quick search uses a contains (case-insensitive) operator. It finds results that include your search term, no matter if the letters are uppercase or lowercase.
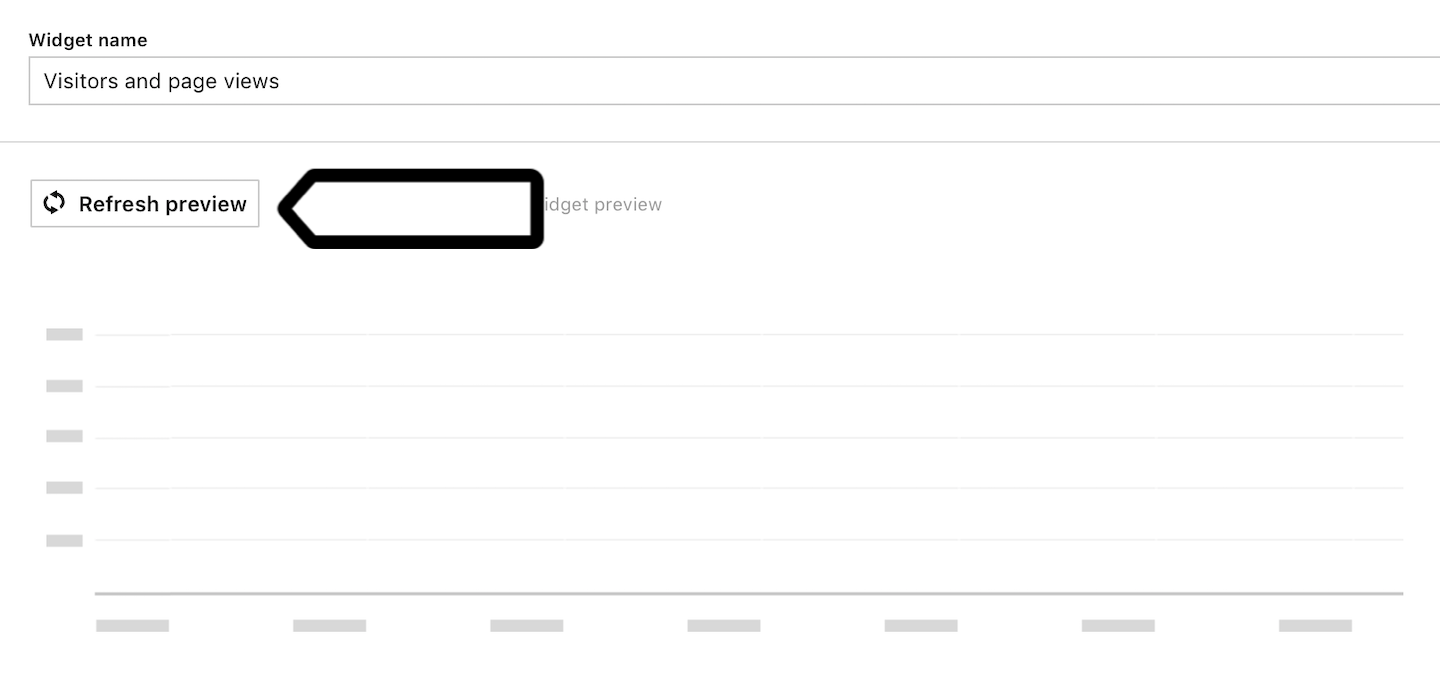
14. Click Refresh preview to get a sneak peek of the report. The preview shows sample data.
15. When you’re happy with the widget, click Save.
16. Create and add other widgets.
17. When done, drag and drop widgets into the desired positions on your dashboard.
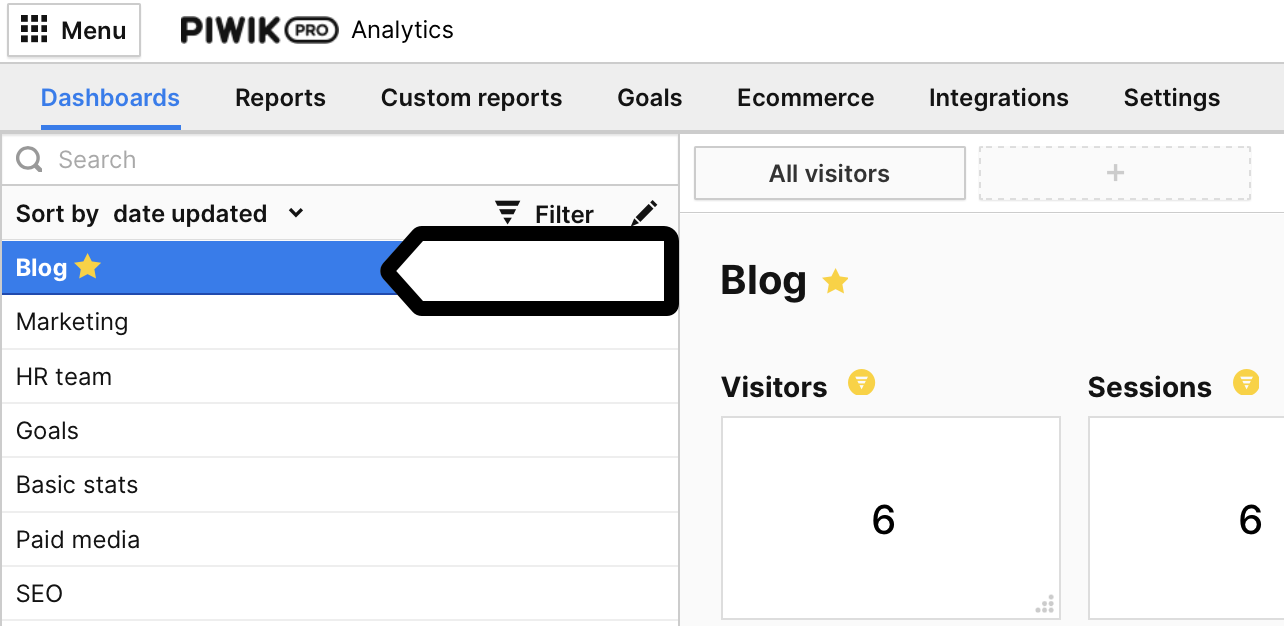
18. (Optional) You can star your dashboard to make it appear at the top of the list.
19. Task completed! Your dashboard is ready.
Tip: Send your teammates a link to your dashboard by simply clicking on Share in the upper right corner. But note that you need to make the shared dashboard visible to “All users” – not just you – and these users need to have access to your site/app.
Edit, copy, save as PDF or delete a dashboard
You can make changes to your dashboard, copy it to another site/app, export it as a PDF or delete it at any time.
To do this, follow these steps:
1. Go to Menu > Analytics.
2. Navigate to Dashboards.
3. Select the dashboard you want to work with.
4. On the right, click the ⋯ three-dot icon.
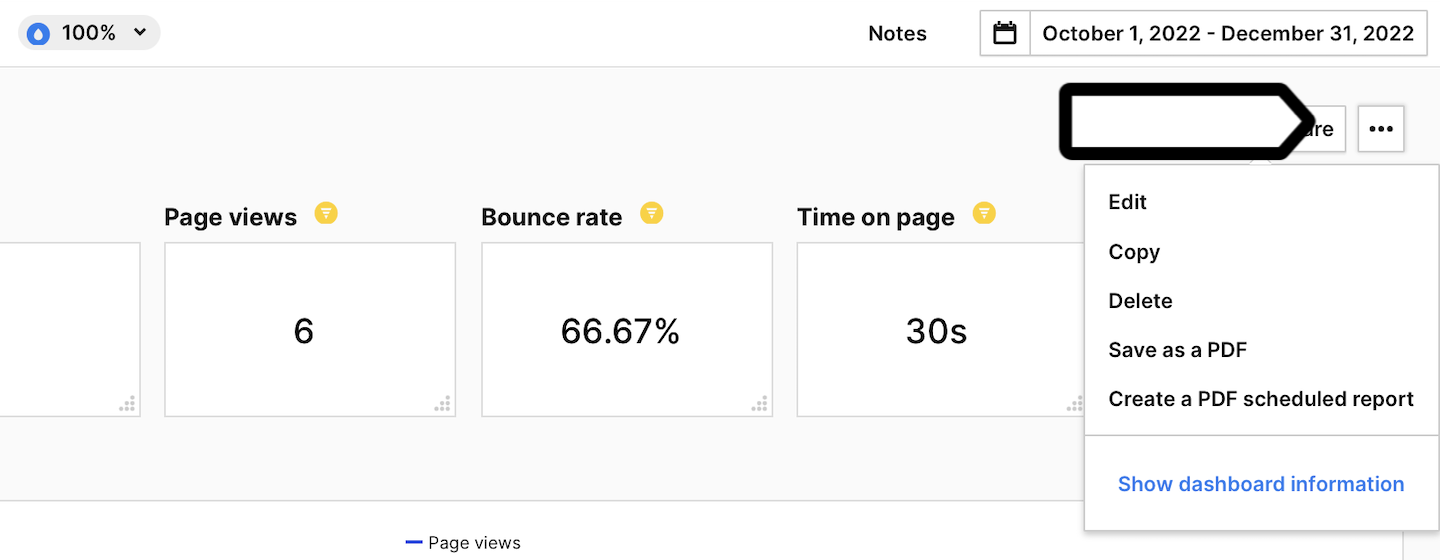
5. Click on one of the following options: Edit, Copy, Delete, Save as a PDF or Create a PDF scheduled report.
6. Follow the steps on the screen.
7. All done!
Edit, copy, delete a widget or export widget data
You can edit your widget, copy it to another site/app, delete it or export data from the widget at any time.
To do this, follow these steps:
1. Go to Menu > Analytics.
2. Navigate to Dashboards.
3. Select the dashboard you want to work with.
4. Select a widget.
5. On the right, click the ⋯ three-dot icon.
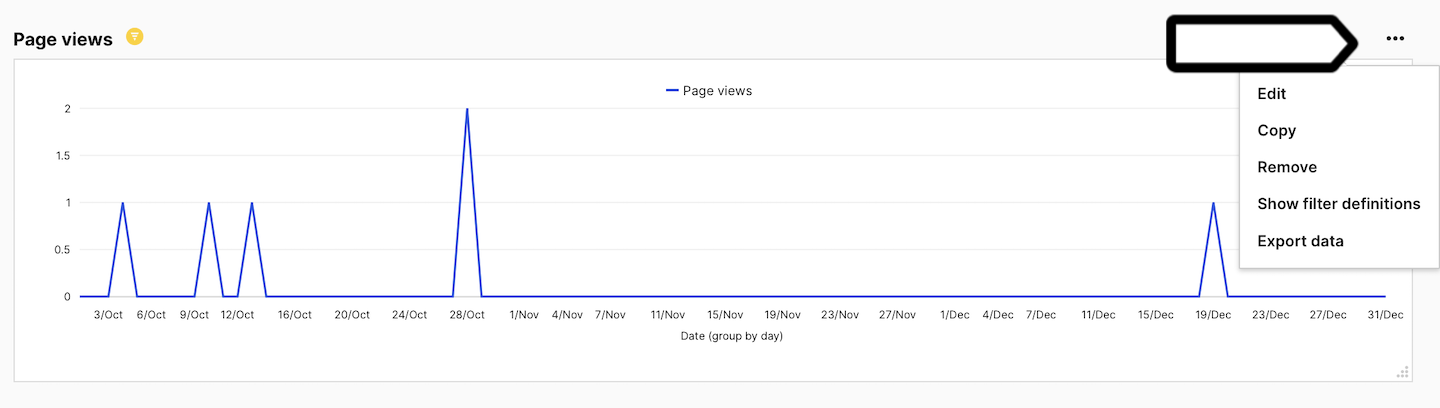
6. Click Edit, Copy, Remove or Export data.
7. Follow the steps on the screen.
8. All set!
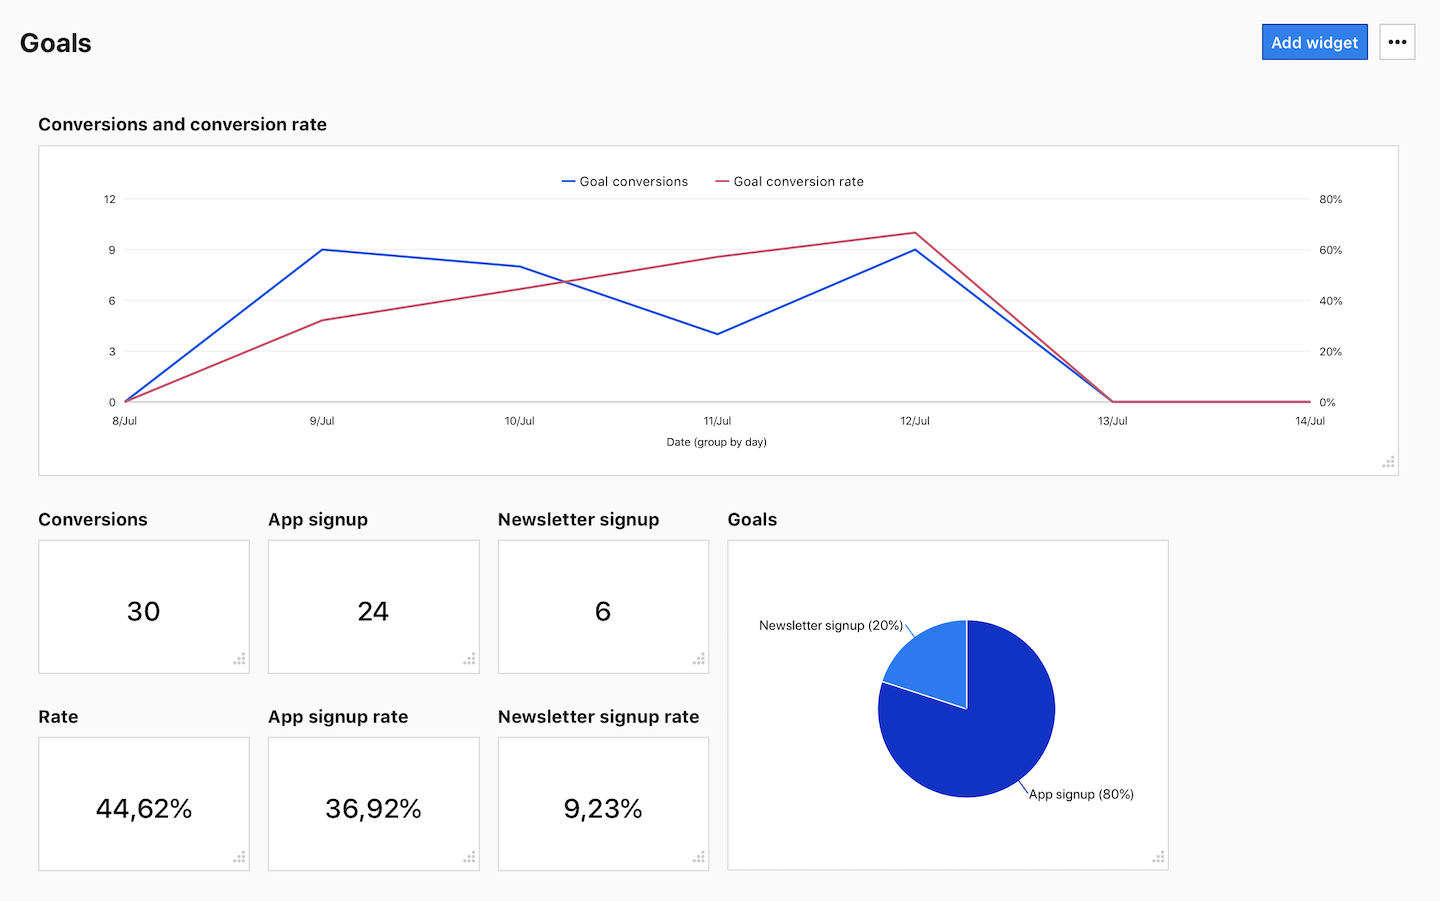
Dashboard examples
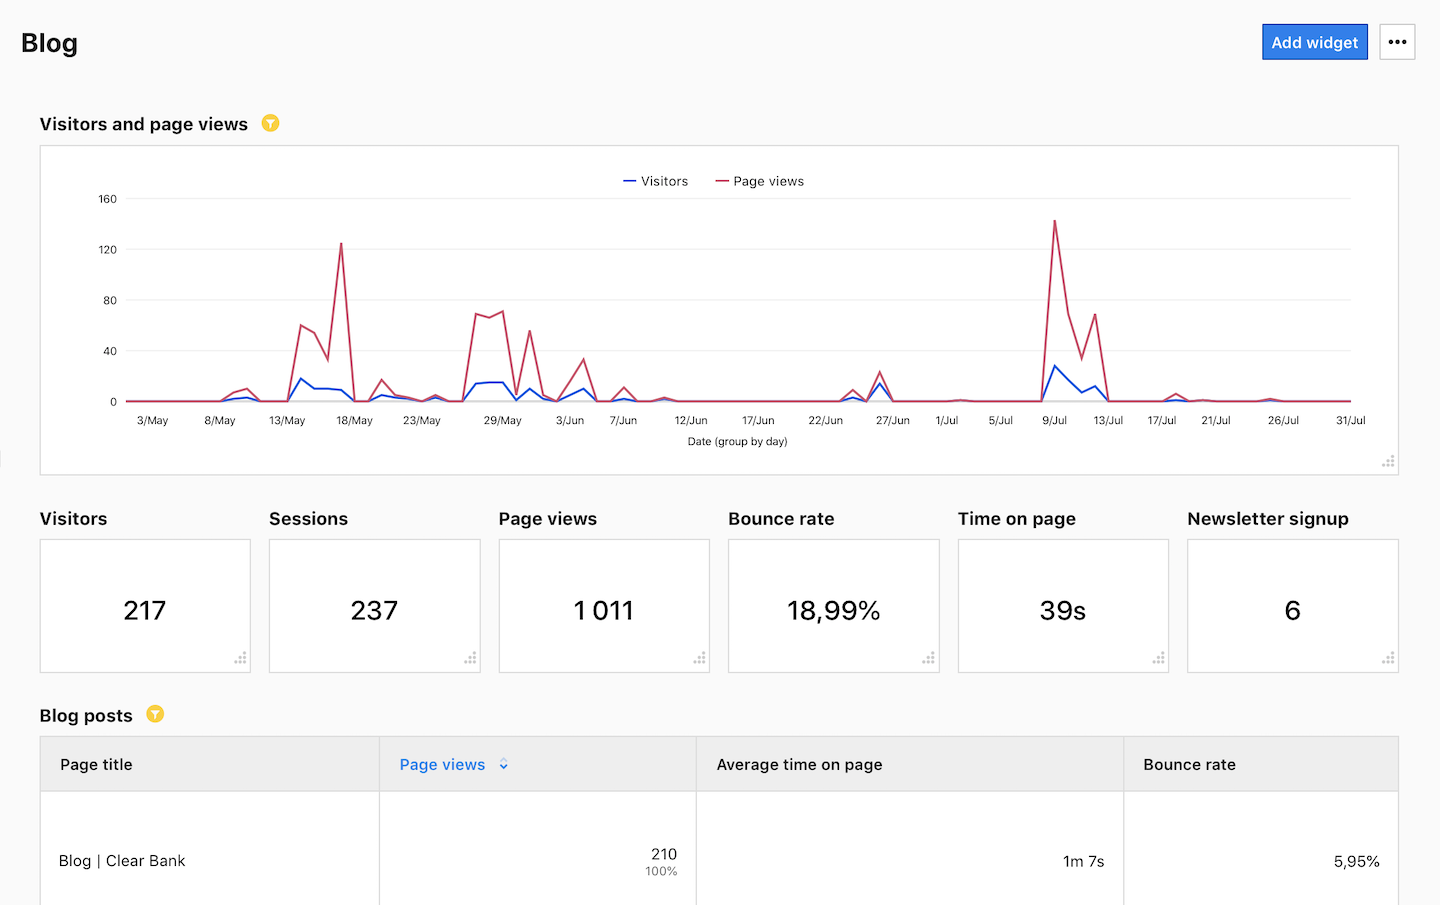
Dashboards are a great tool because they let you display data essential to your business in a way that suits you. So, instead of creating spreadsheets, you can create dashboards that show you exactly what you need.
To spark some ideas, here’s an example of a dashboard for displaying goals on a sample Clear Bank website. Use it as inspiration for your own dashboard.