Up until now, you’ve learned about audience reports and acquisition reports. So you know who your visitors are and where they come from. Now it’s time to find out how they interact with your site.
The behavior reports will tell you what content people read, which pages are most popular, how people navigate between pages, and what they look for using a search on your site. With this data, you’ll know how to structure information for easy navigation.
There are several behavior reports and we’ll show you a few of the most useful to give you a good start.
To access behavior reports, follow these steps:
1. Go to Menu > Analytics.
2. Navigate to Reports.
3. On the left, click the report you want to work with.
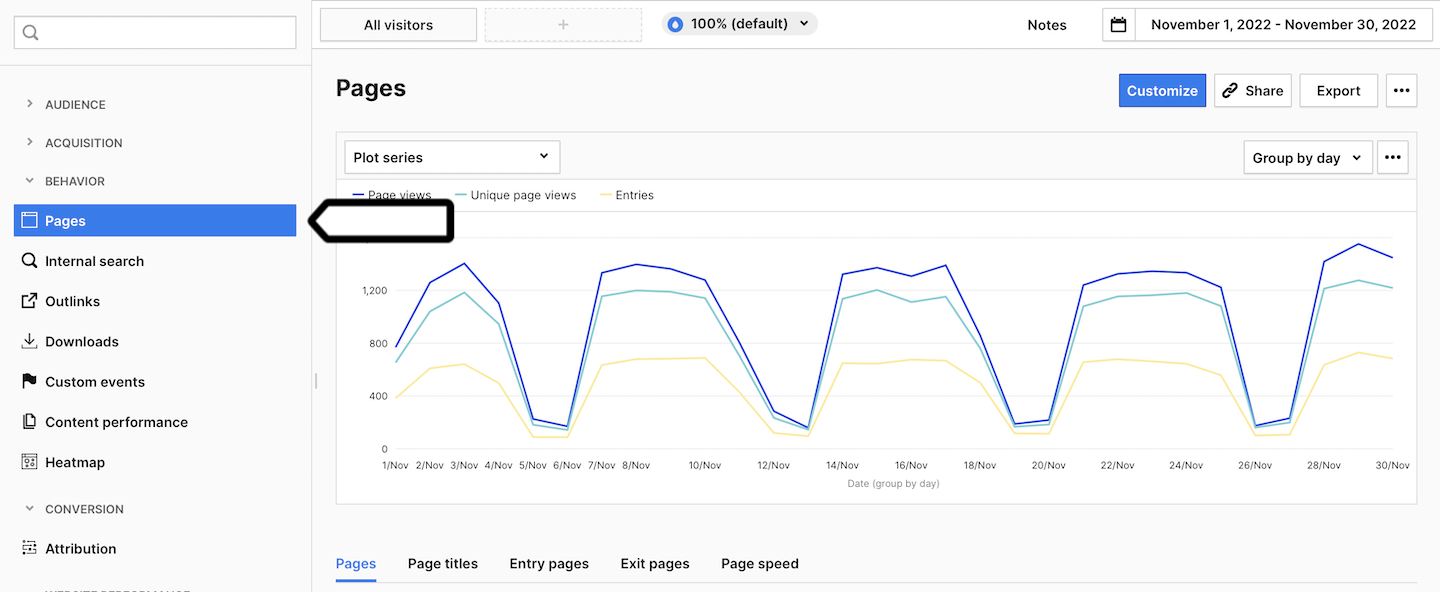
First, we’ll look at the page report.
Page report
The page report shows you all visited pages on your website defined by a page URL. For each page, you can view several metrics such as page views, unique page views, entries, page bounce rate and exit rate. All these metrics will help you understand how popular and useful the pages are.
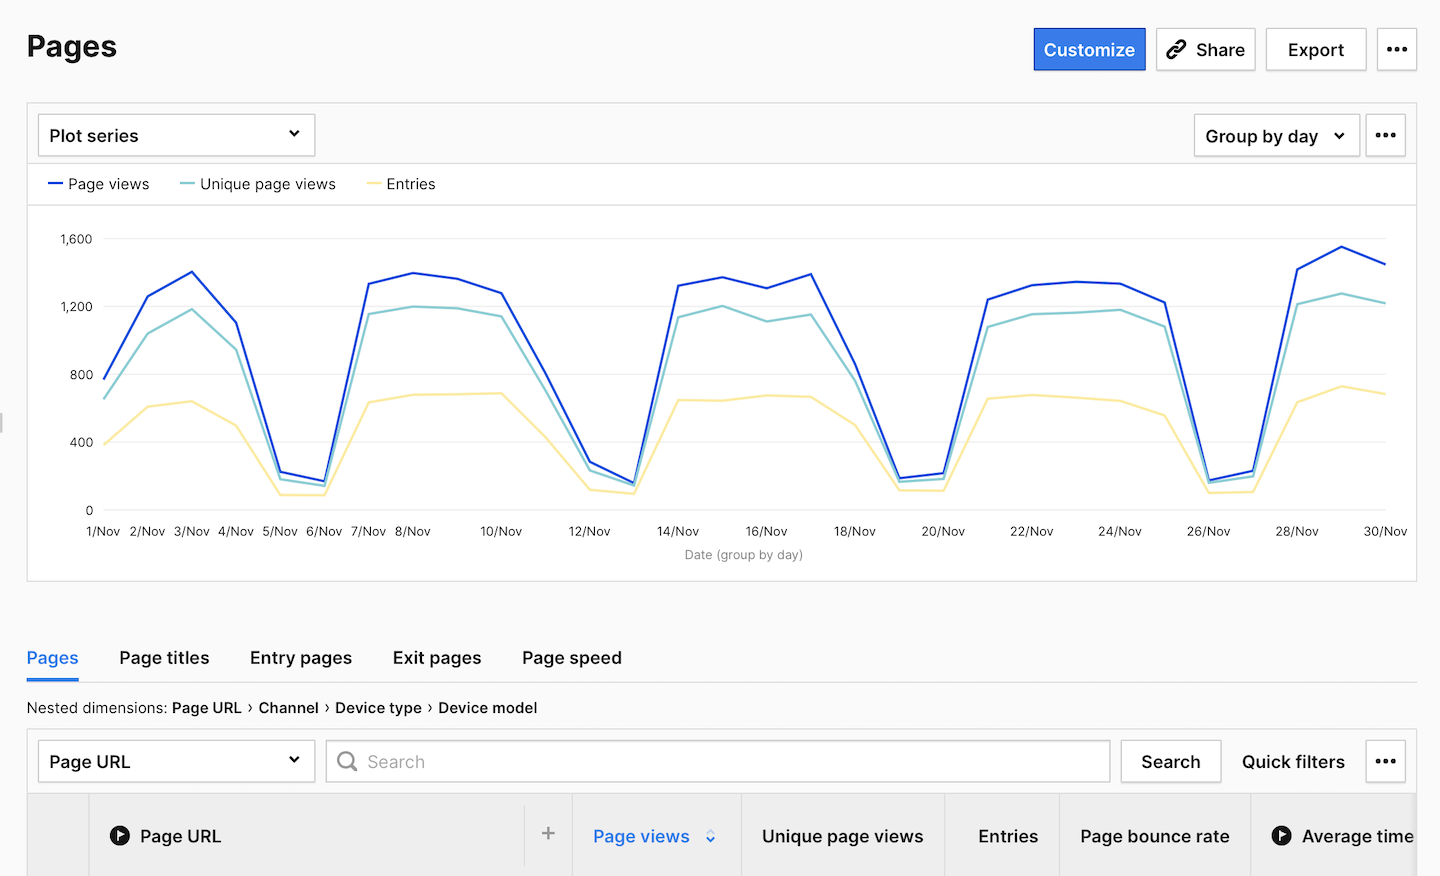
To better understand these metrics, let’s take a closer look:
- Page views: The number of times a page was visited.
- Unique page views: The number of unique visits to the page. If a visitor views the page several times during one session, the page view will be counted only once.
- Entries: The number of views of the first page displayed during a session.
- Page bounce rate: An accurate bounce rate for a page URL or page title. The percentage of sessions in which visitors only viewed that page and didn’t proceed to another page, goal conversion or order.
Page bounce rate = (Bounces / Entries) * 100%. Read more - Exit rate: The percentage of sessions that ended on the selected page.
Exit rate = Exits / Sessions * 100%.
If you wish to delve into the page report, you can sort each metric in ascending and descending order by clicking the column header for the metric. And if you want to see a channel, device type and device model for a particular page, click the page URL.
To see details for a page, follow these steps:
1. Click on the URL of the page whose details you want to see.
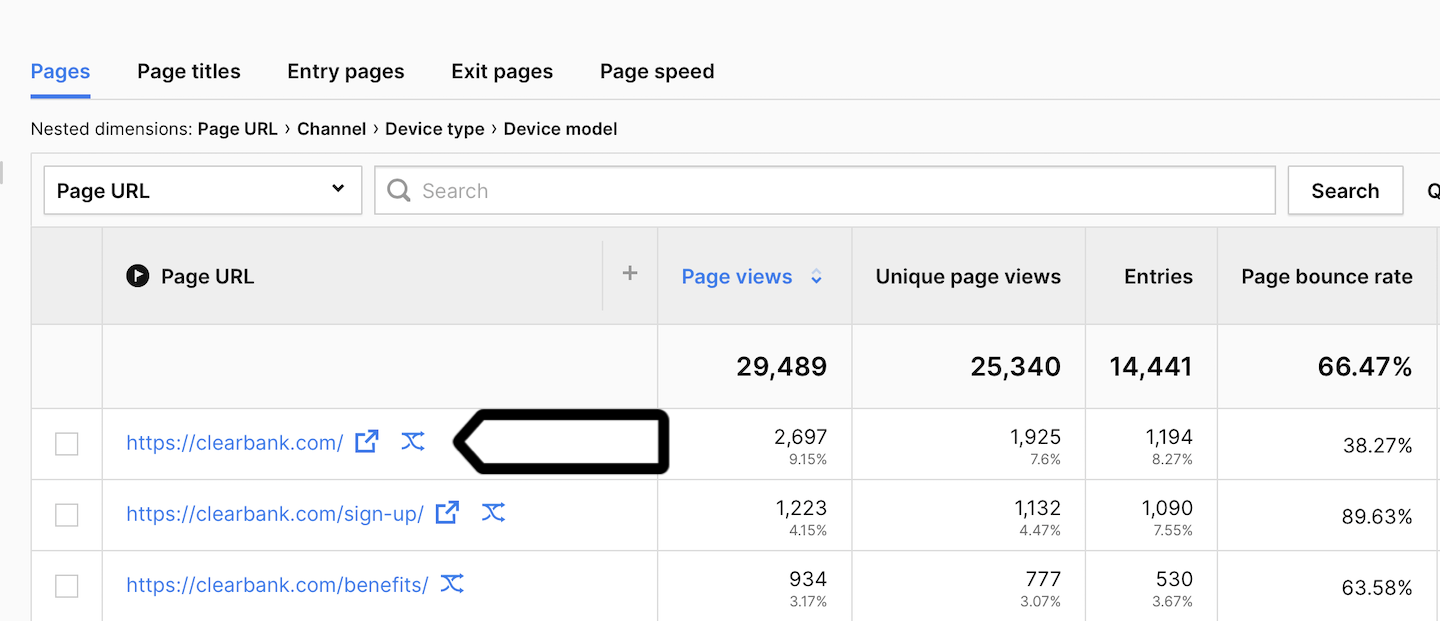
2. To view other details, keep clicking nested elements.
Tip: If you’d like to see the same report with page titles instead of page URLs, use the page title report. Additionally, you can use the entry page report to see pages that people viewed first during their sessions, and exit page report to see the pages that people viewed last. You can also explore the page speed report that will tell you how long a page loads in the visitor’s browser.
Internal search report
The internal search report is designed to show keywords people are typing in a search on your website (if you have one). This report is the best place to inquire into user’s needs and wants regarding your website.
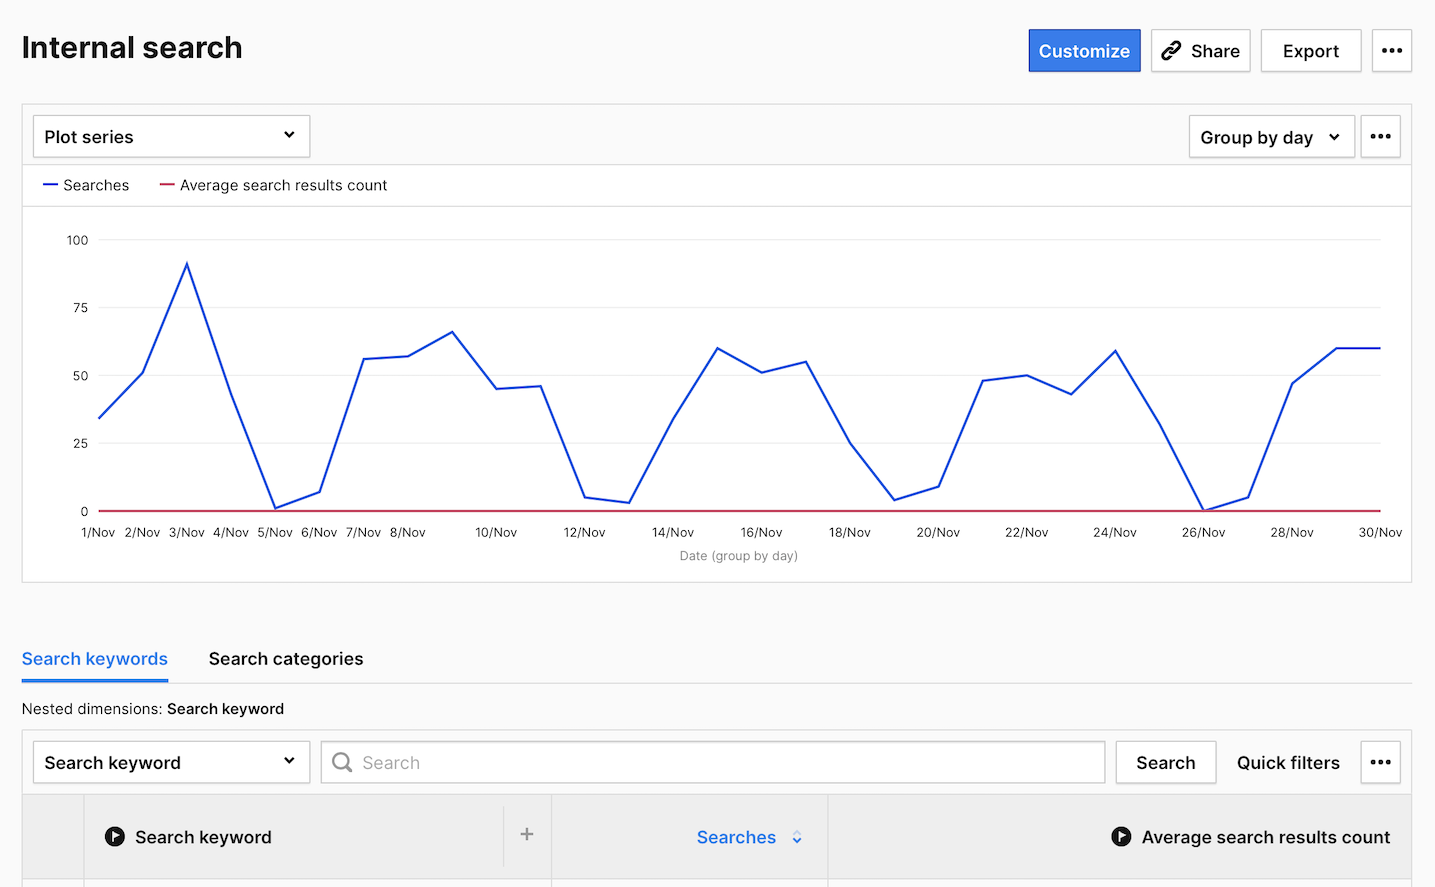
By default, the internal search tracking is turned on for every website. Piwik PRO tracks the most popular search query parameters like q, query, s, search and searchword. However, if your website uses different queries, you’ll need to add them to website’s settings under Menu > Administration > Sites & apps > Data collection > Internal search engine.
Outlink report
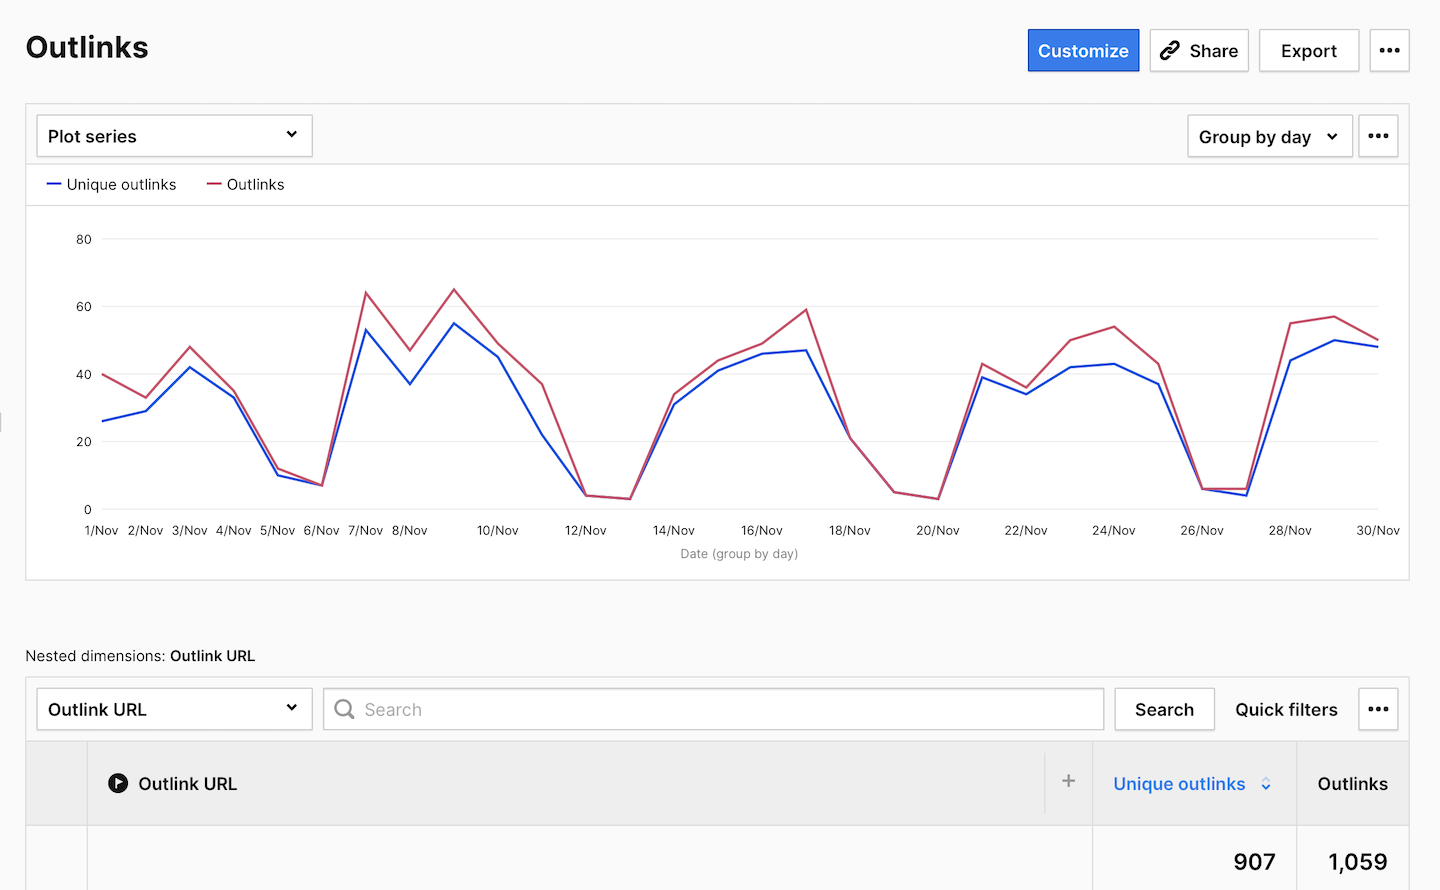
The outlink report is all about the links on your website that send people to other websites. These could be domains that you own, for example, a domain that you have for a help center or blog. Or these could be other domains that you don’t own but are linking to on your site, for example, facebook.com, youtube.com, medium.com.
The report will show you the clicked URL and two metrics: unique clicks and clicks. So you will learn if people are using links, and where they usually go by clicking on them.
Other reports
Within behavior reports, you’ll also find the download report showing information about all files that people downloaded from your website, and the custom event report that helps you analyze events that happened on your site. Yet, the event report will work once you set it up. We will explain more about the custom event report in the next course.
