Whenever you run an ad campaign, be it a newsletter, banner ad, social media ad or in-app ad, you probably want to know how it performs. Which creative attracts the most people? Which source refers the most traffic?
Using Analytics and campaign report, you can track the traffic from your campaigns and see how they are doing. To collect information about a campaign you need to add parameters to its destination URL. For example, if you’re running a winter campaign through a pop-up ad on your website, newsletter, Google Ads and Facebook Ads, you can tag the URL for each of these campaigns. Every time somebody clicks a tagged link, the parameters that you’ve added will be sent to Analytics and data about the campaign will be available in the campaign report.
Parameters that you can add
You can decide if you want to add pk_ or utm_ parameters. Both of them will be collected and recognized by Piwik Pro.
There are six parameters you can add to your URLs:
- pk_campaign or utm_campaign: The name for a campaign. For example, Winter_Promo.
- pk_source or utm_source: It helps you identify the advertiser, website, publication and more. For example, Newsletter, Facebook, Google.
- pk_medium or utm_medium: It describes the medium used for advertising. For example, CPC, banner, sponsored_post.
- pk_keyword or utm_term: It helps you identify paid search keywords. For example, free_bank_account.
- pk_content or utm_content: It is used to separate similar content within the same ad. For example, if you have a newsletter with two call-to-action buttons, you can tag each link for each button with a different pk_content parameter, and see which version is working better.
- pk_cid or utm_id: It helps you differentiate campaigns using an ID number. For example, if you are using two similar creatives for Facebook, and want to see which one performs better, you can tag them with a different pk_cid parameter.
How to add parameters
You can add parameters manually, or you can use the Piwik PRO URL Builder.
For example, if Clear Bank was running a Winter Promo campaign on Facebook using a sponsored post, they would use the following parameters:
- pk_campaign or utm_campaign: Winter_Promo
- pk_source or utm_source: Facebook
- pk_medium or utm_medium: Sponsored_Post
If they used the pk_ parameters, the campaign URL would look like this:
https://clearbank.com?pk_campaign=Winter_Promo&pk_source=Facebook& pk_medium=Sponsored_PostAnd if they used the utm_ parameters, the campaign URL would look like this:
https://clearbank.com?utm_campaign=Winter_Promo&utm_source=Facebook& utm_medium=Sponsored_PostUTM Parameters Converter
You can also convert utm_parameters into Piwik PRO pk_ parameters using our Piwik PRO URL Builder.
Just add or copy the full website URL with all utm_ parameters into the form and you will get the full website URL with the pk_ parameters.
View data in the campaign report
Once you set up your campaigns, you can see data related to these ads in the campaign report.
To see the campaign report, follow these steps:
1. Go to Menu > Analytics.
2. Navigate to Reports.
3. On the left, click Campaigns.
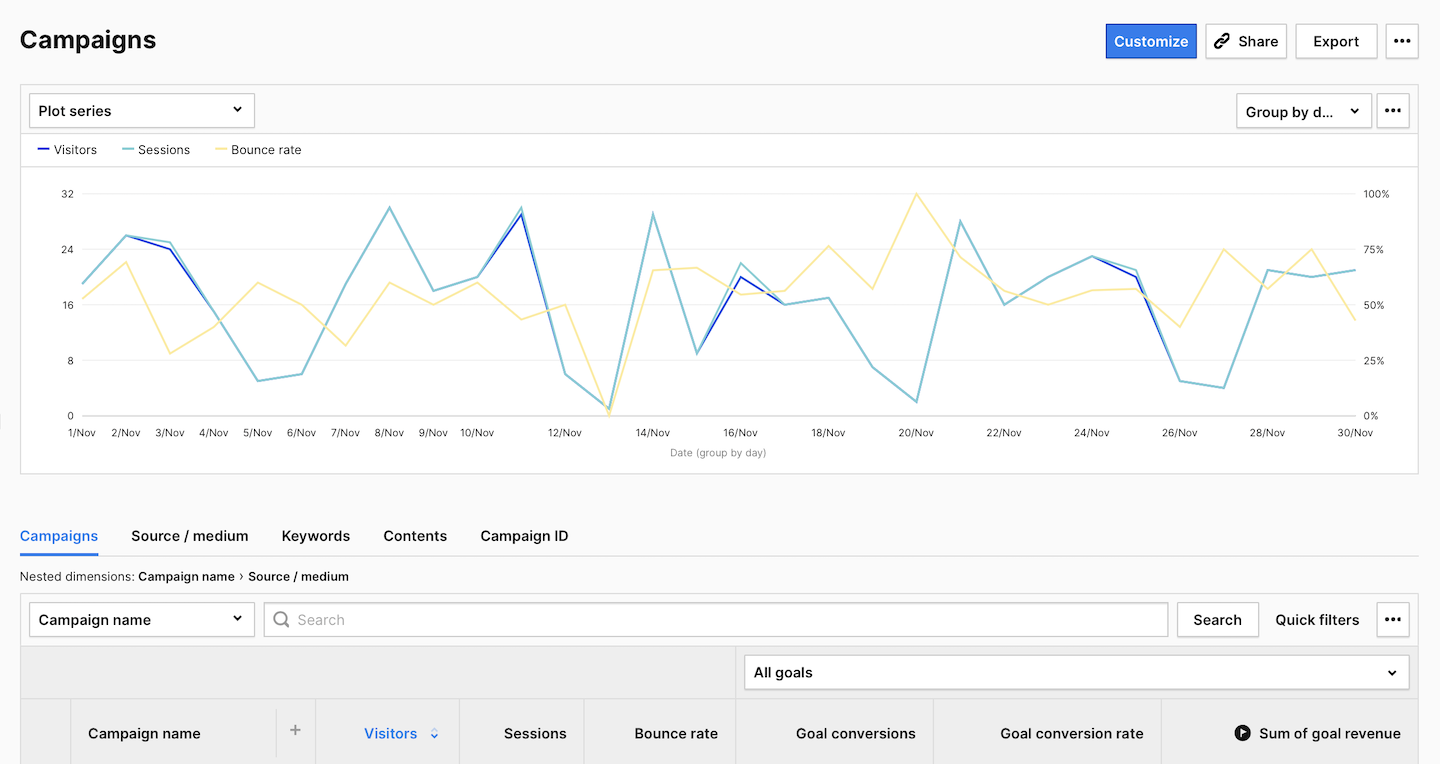
This report will show you data grouped in five categories based on parameters used for tagging campaigns:
- Campaigns
- Source / medium
- Keywords
- Contents
- Campaign ID
In the report you will see the following metrics:
- Visitors: The number of unique visitors. Every visitor is counted once, even if they visit the website many times during the day. Read more
- Sessions: The number of sessions performed by visitors. A session starts with the first event and ends 30 minutes after the last event performed in that session. Read more
- Bounce rate: The percentage of sessions in which visitors only viewed one page and didn’t proceed to another page, goal conversion or order.
Bounce rate = Bounces / Sessions * 100%. Read more - Goal conversion rate: The percentage of sessions in which visitors completed a goal.
Goal conversion rate = Sessions with a completed goal / Sessions * 100%. (You need to set goals to collect this data.) - Sum of goal revenue: The amount of revenue generated by a goal. (You need to set goals to collect this data.)
By looking at the number of visits coming from each campaign, you will be able to quickly tell how they perform. Then you might decide to invest more in leading creatives or sources, and less in not-so-good ones.