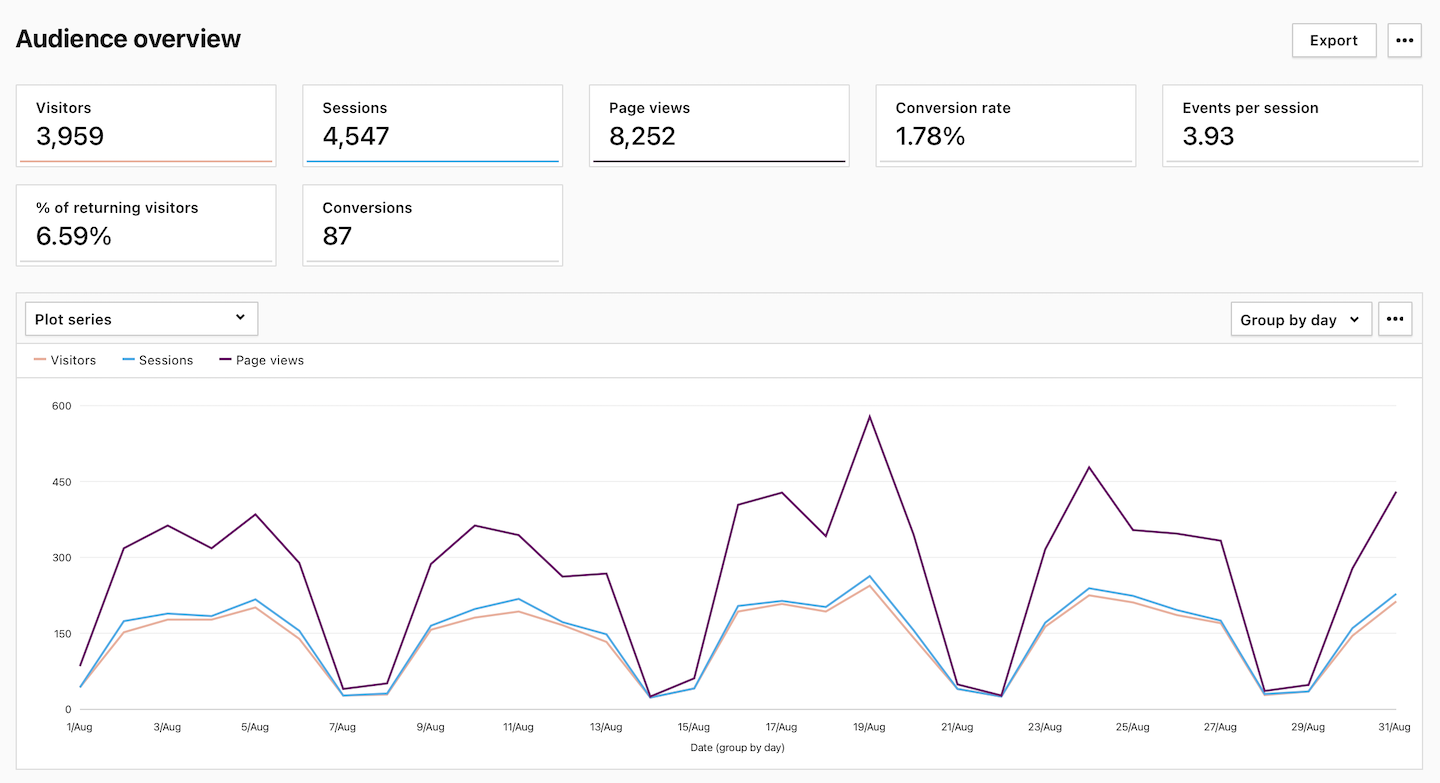
The audience overview report gives you a bird’s-eye view of what’s happening with your site visitors. It shows you key info like the number of visitors, sessions, page views and conversions. It’s a handy report that helps you understand visitor behavior without overwhelming you with details.
To view the report, follow these steps:
1. Go to Menu > Analytics.
2. Navigate to Reports.
3. On the left, click Audience overview.
4. Done! You can now view your report.
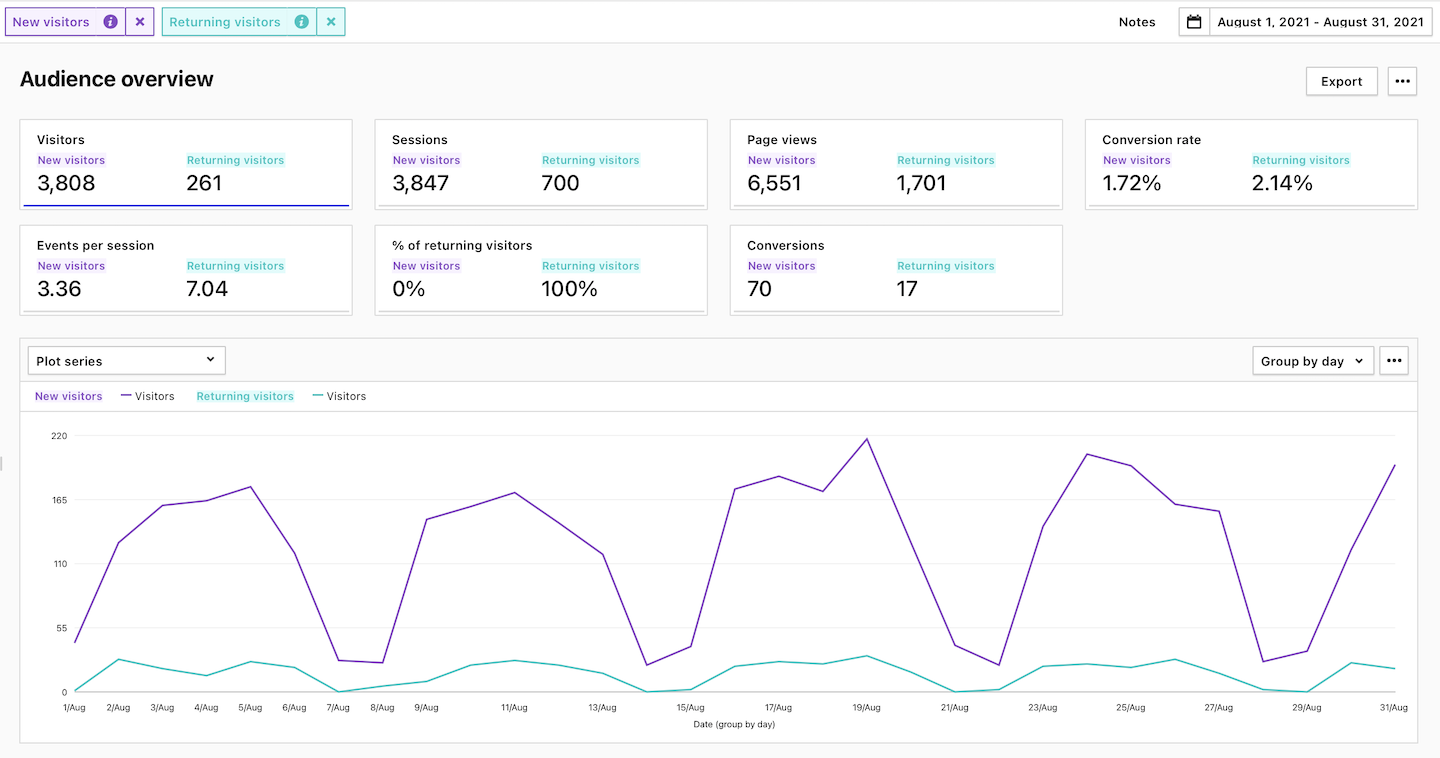
5. (Optional) Apply segements and quickly compare visitors.
Metrics in the report
The table below describes the metrics you’ll find in your audience overview report.
| Metric name | Description |
|---|---|
| Sessions |
The number of sessions performed by visitors. A session starts with the first event and ends 30 minutes after the last event performed in that session. Note: Learn more about sessions. |
| Visitors |
The number of unique visitors. Every visitor is counted once, even if they visit the website many times during the day. Note: Learn more about visitors. |
| Page views | The number of times a page was visited. |
| Events per session | The average number of events in a session. Events per session = Events / Sessions. |
| % of returning visitors | The percentage of people who came back to your website again. |
| Conversions |
The number of goal completions. Note: You need to set goals to collect this data. |
| Conversion rate |
The percentage of sessions in which visitors completed a goal. Note: You need to set goals to collect this data. |
Note: You can export this report to a CSV, XML, JSON or JSON (KV) file format or share it with your teammates.
Watch more tutorials on YouTube: