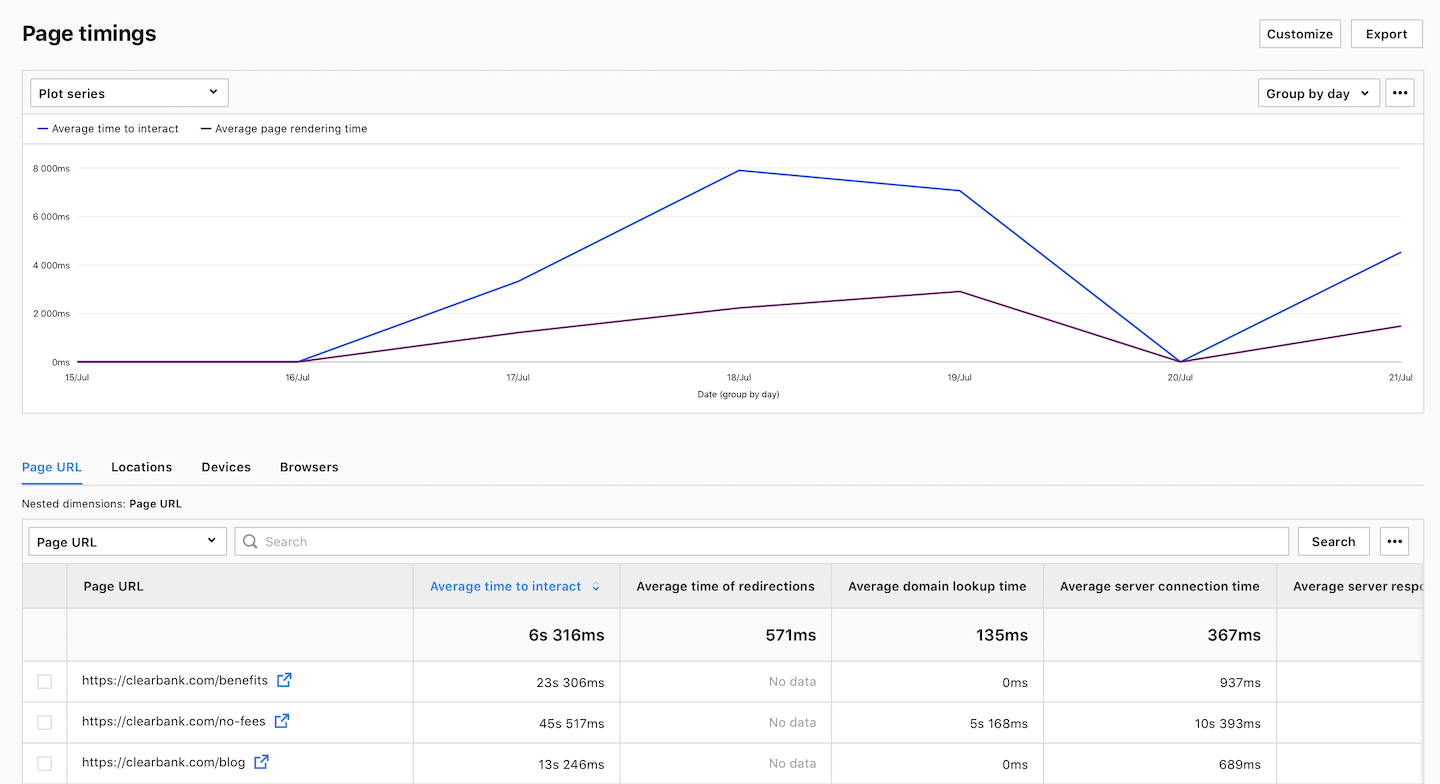
The page timing report allows you to see how fast your site loads in a visitor’s browser. This is an important report for your developers who know how to work with the inside of your site.
In this report, you’ll see four sections:
- Page URL: This section allows you to determine the speed at which your web pages load. By using it, you can identify if a specific landing page has a slow loading speed and then take action to improve that page or redirect visitors to a landing page that loads more quickly.
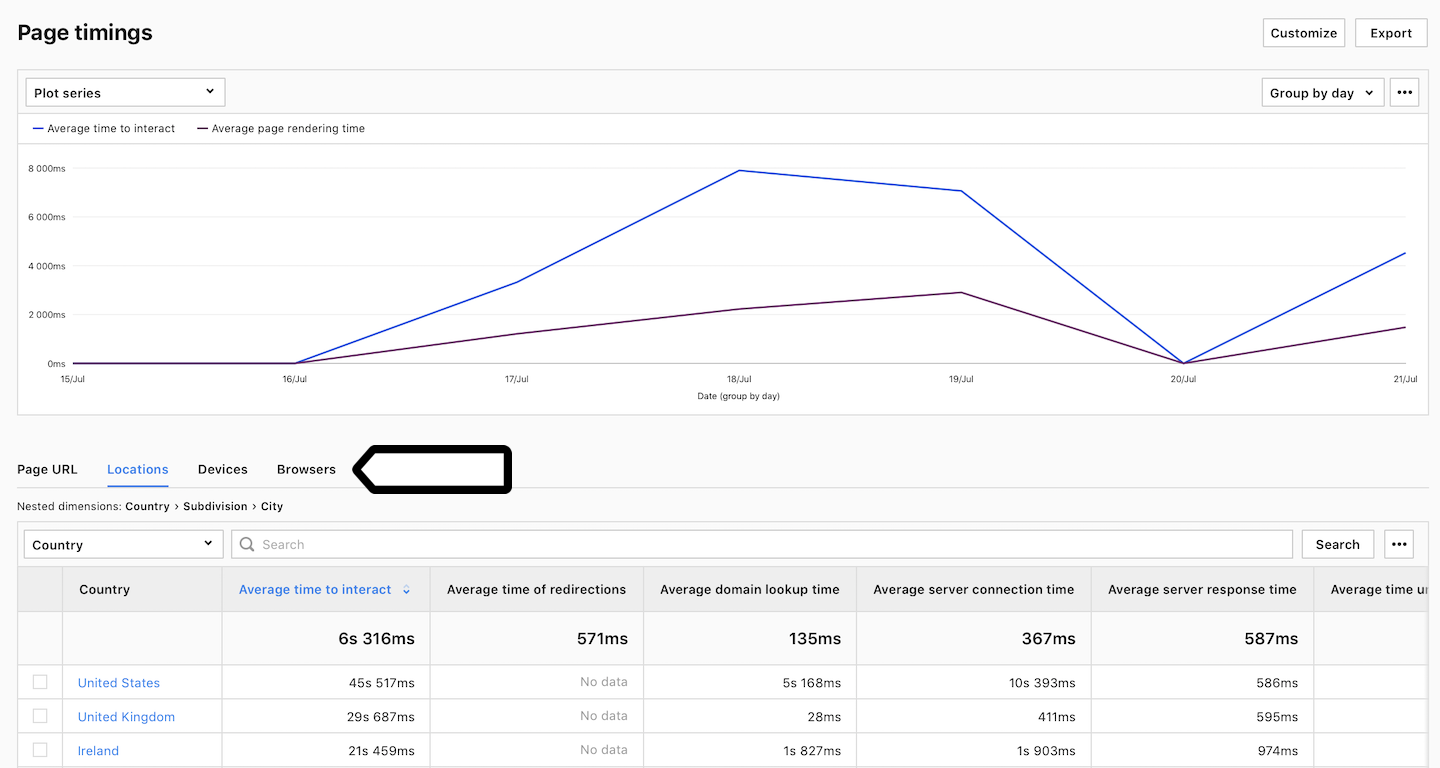
- Location: This section helps you identify areas where your site loads significantly slowly. For example, you might discover that your target audience resides in an area with a poor internet connection. Armed with this knowledge, you can work on creating an optimized version of your site or landing pages to keep your audience engaged despite the slow loading times.
- Device: In this section, you can assess the loading speed of your site on different devices and identify any issues that may arise. For example, you might observe that your site loads slowly on Android devices and take steps to optimize it specifically for this type of device.
- Browser: In this section, you can uncover any issues that may occur across different web browsers. For example, you might notice that a group of visitors using Safari experiences slow loading times. Being aware of this, you can redesign your site to deliver a site that performs well on this particular browser.
To view the report, follow these steps:
1. Go to Menu > Analytics.
2. Navigate to Reports.
3. On the left, click Page timings.
4. Voila! You can now view your report.
5. (Optional) Click a section name to view a specific section of this report.
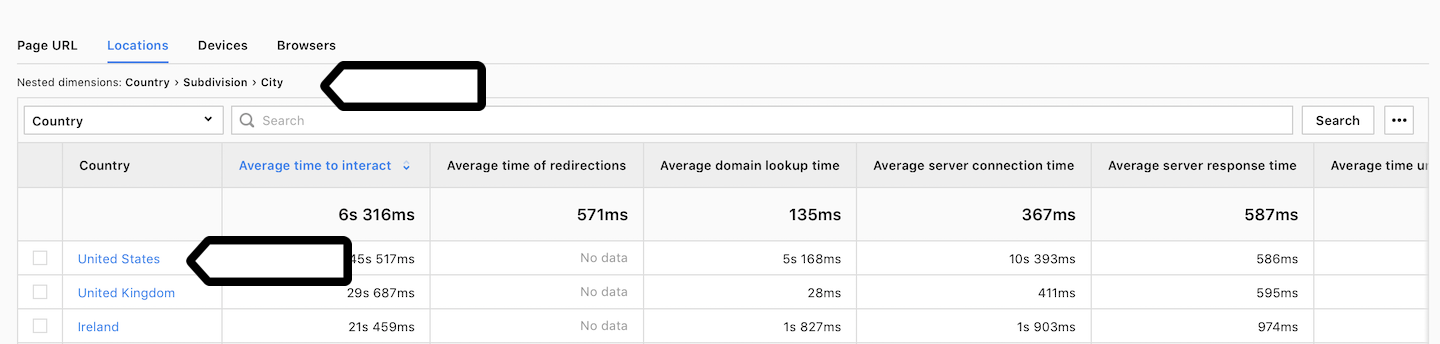
6. (Optional) If you come across a nested dimension in the report, simply click on the dimension to explore more detailed data.
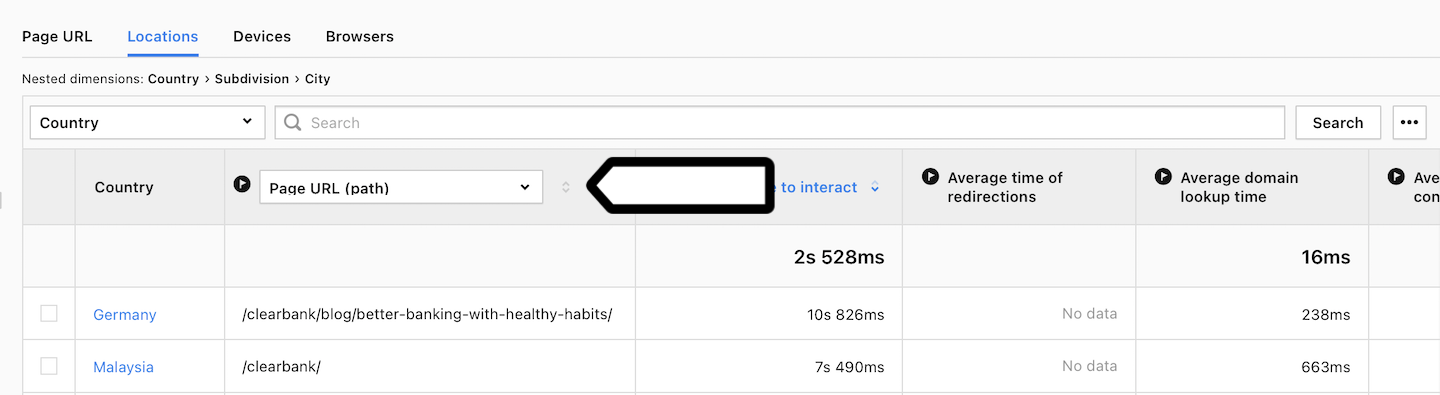
7. (Optional) If you want to see two dimensions in a single view, click + and choose a dimension. and choose a dimension.
Metrics in the report
The table below describes the metrics you’ll find in your page timing report.
| Metric name | Description |
|---|---|
| Time to interact | The time it takes from when a user sends a request (clicks a link or submits a form) to when the page has fully loaded and can be used. This is the total transaction time between client and server. |
| Time of redirections | The time it takes to complete one or more redirects. Transactions that don’t have HTTP redirects are not included in the average value calculation. |
| Domain lookup time | The time it takes to resolve the server’s IP address. |
| Server connection time | The time it takes to connect to the web server. |
| Server response time | The time it takes to receive the first byte of the response from the server to a browser request. |
| Time until DOM is ready | The time it takes to process the HTML and CSS page document. |
| Page rendering time | The time it takes to create the render tree, layout and finally draw the page in the browser. |
Note: We calculate page timing metrics based on data provided by the visitor’s browser engine. However, browser engine data becomes available after a page view is tracked, so we send an additional request (page performance metric ping) to collect more data. We send such a request to 10% of page views by default, but you can change this sample size.
Note: You can customize this report, apply segments to it, export it to a CSV, XML, JSON or JSON (KV) file format or share it with your teammates.
Watch more tutorials on YouTube: