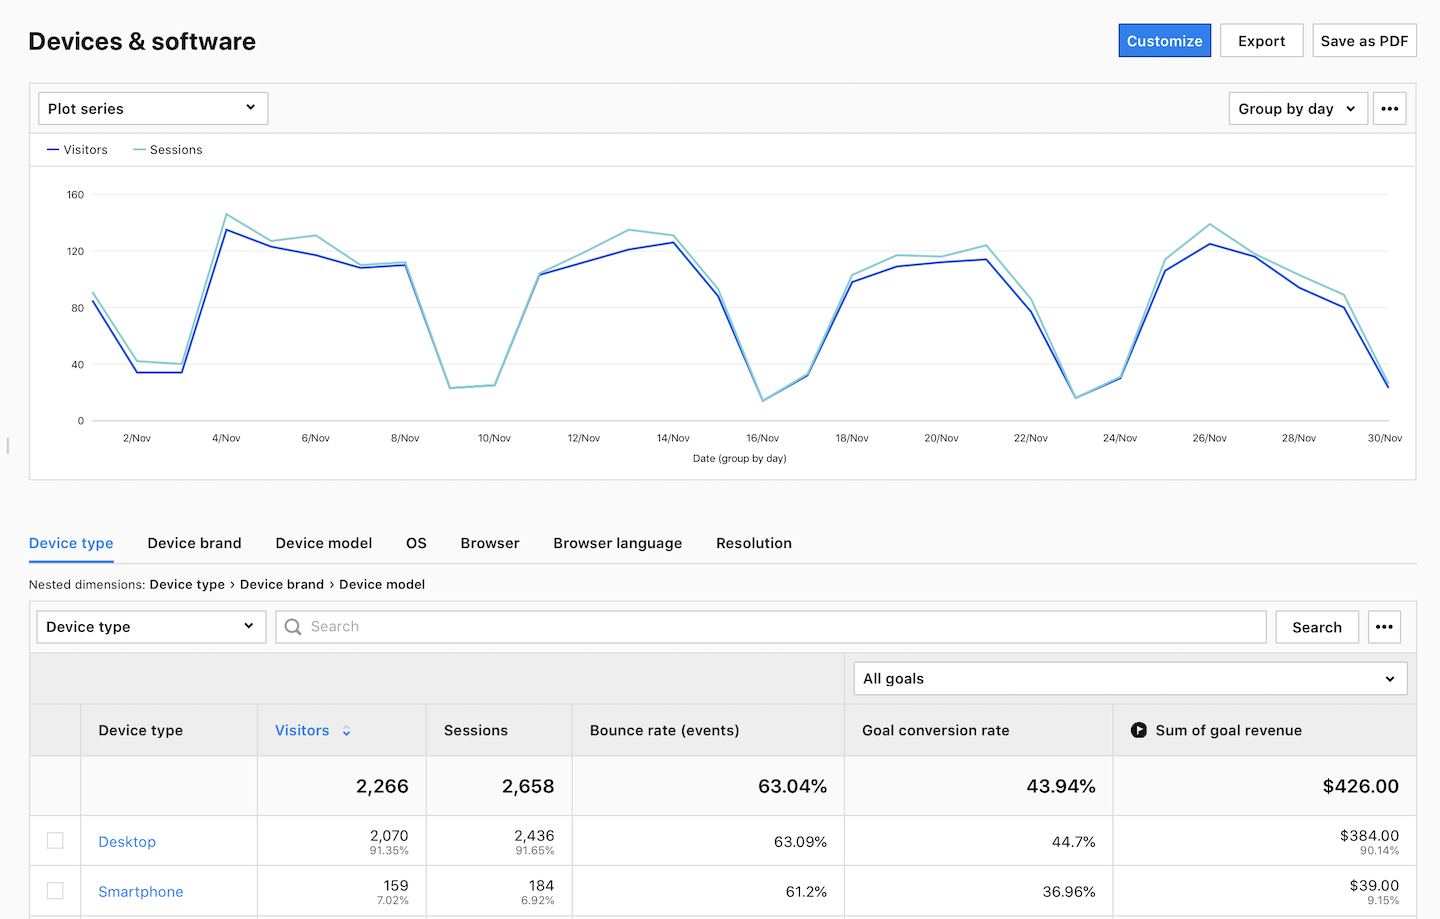
The device & software report tells you what devices and software people use when they visit your site. It gives you info about the type of device, brand, model, operating system, browser, language and screen resolution. You can share this report with your web developers and designers to help them create a user-friendly site.
To view the report, follow these steps:
1. Go to Menu > Analytics.
2. Navigate to Reports.
3. On the left, click Devices & software.
4. Voila! You can now view your report.
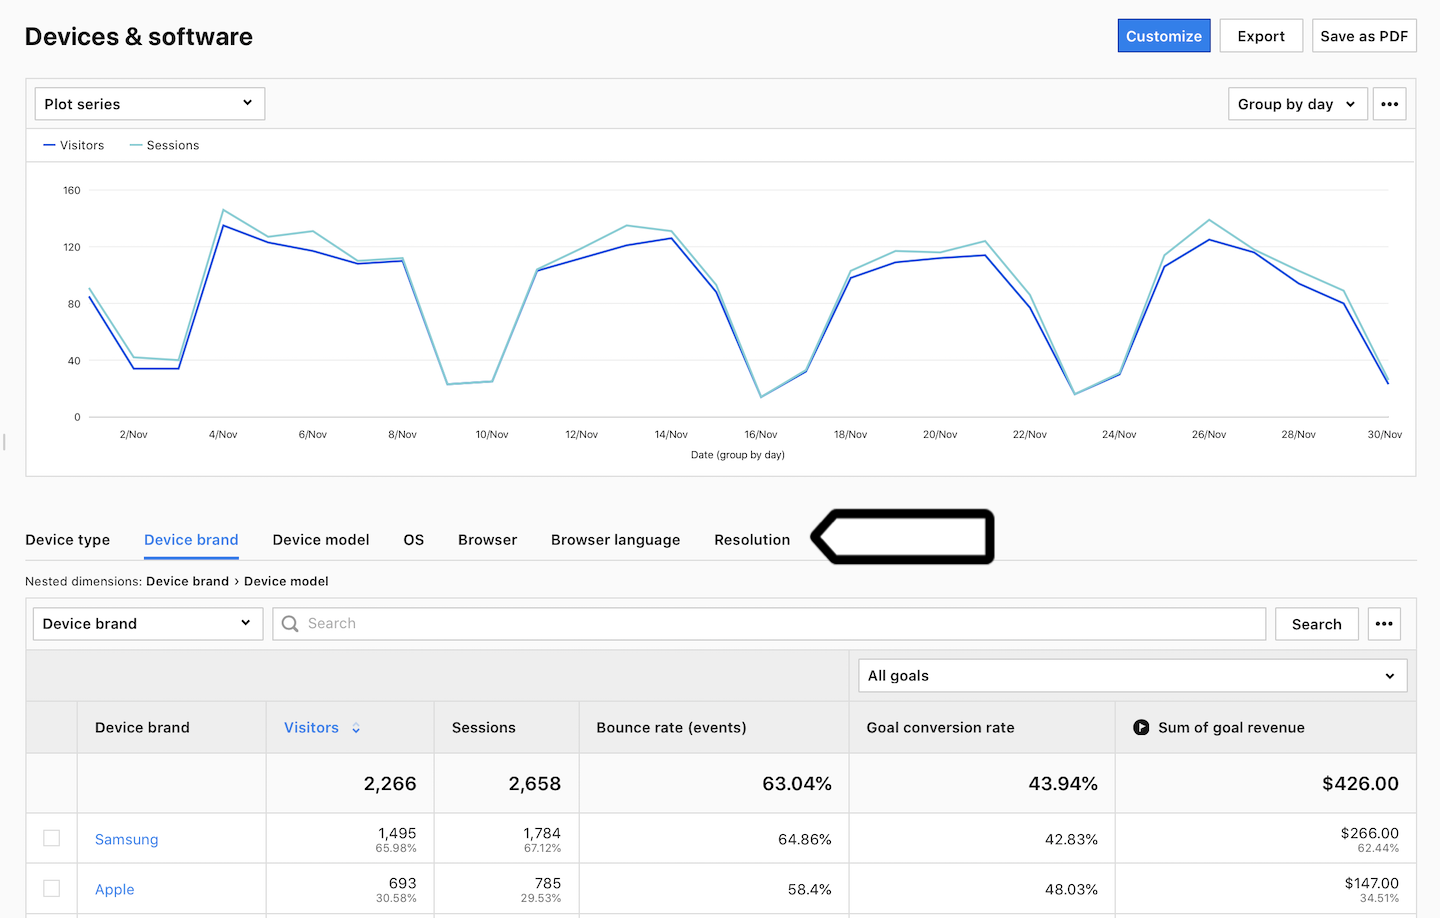
5. (Optional) Click a section name to view a specific section of this report.
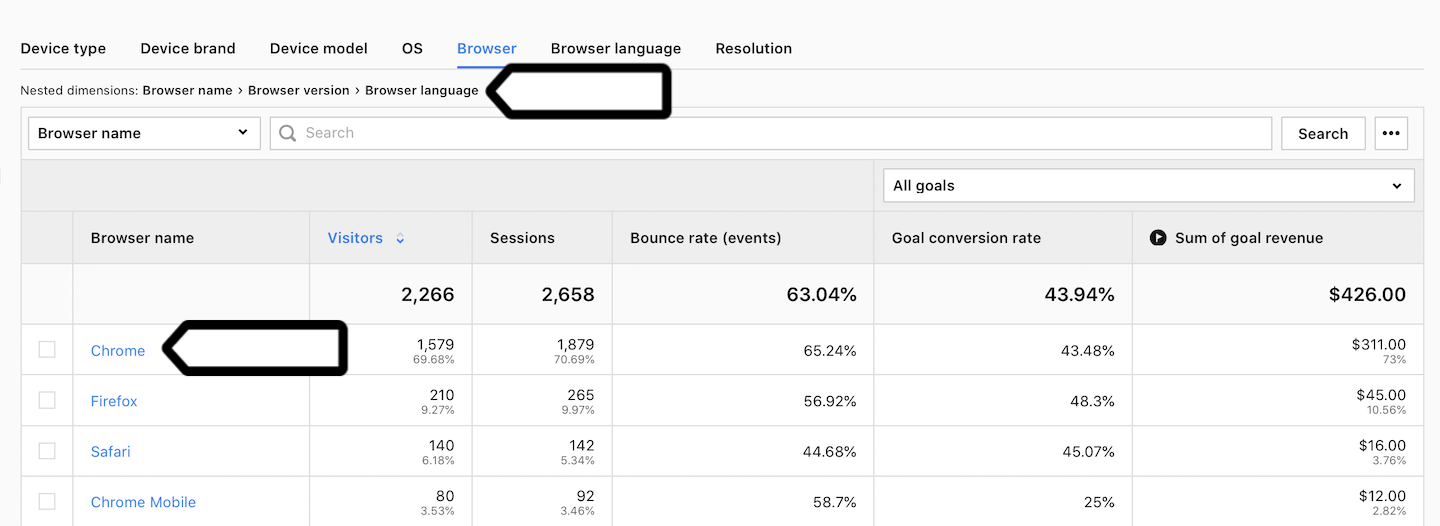
6. (Optional) If you come across a nested dimension in the report, simply click on the dimension to explore more detailed data.
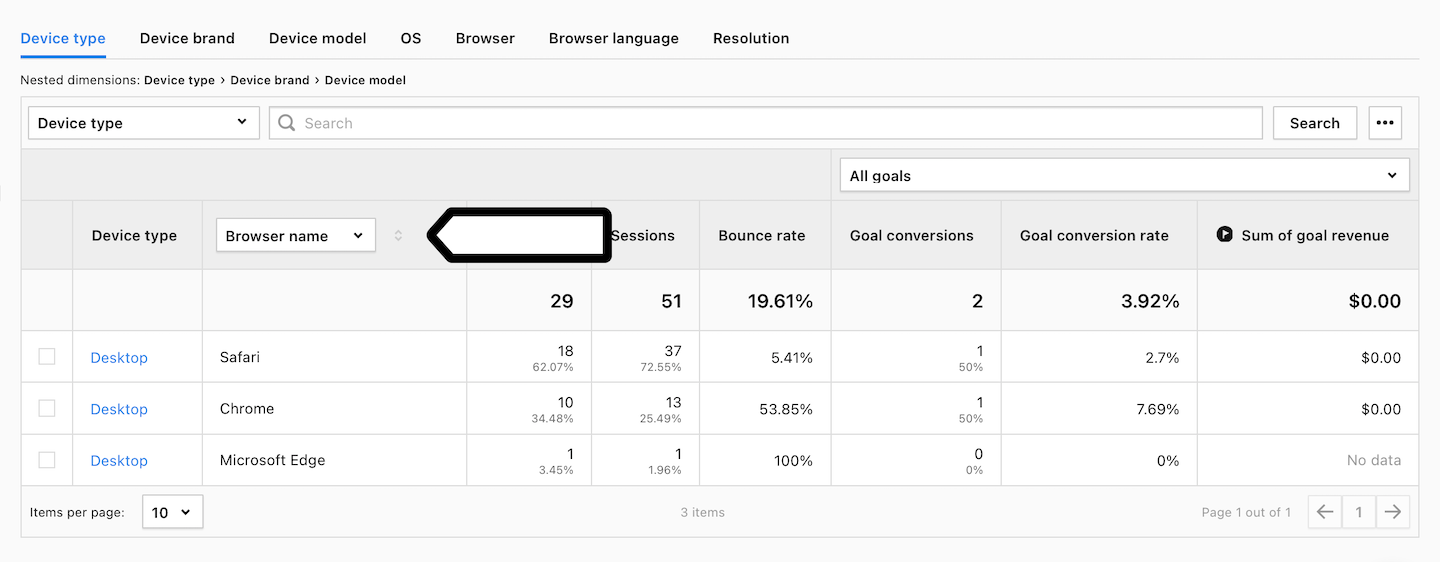
7. (Optional) If you want to see two dimensions in a single view, click + and choose a dimension.
Metrics in the report
The table below describes the metrics you’ll find in your device & software report.
| Metric name | Description |
|---|---|
| Visitors |
The number of unique visitors. Every visitor is counted once, even if they visit the website many times during the day. Note: Learn more about visitors. |
| Sessions |
The number of sessions performed by visitors. A session starts with the first event and ends 30 minutes after the last event performed in that session. Note: Learn more about sessions. |
| Bounce rate |
The percentage of sessions in which visitors only viewed one page and didn’t proceed to another page, goal conversion or order. Note: Learn more about bounce rate |
| Goal conversion rate |
The percentage of sessions in which visitors completed a goal. Note: You need to set goals to collect this data. |
| Sum of goal revenue |
The amount of revenue generated by a goal. Note: You need to set goals to collect this data. |
Note: You can customize this report, apply segments to it, export it to a CSV, XML, JSON or JSON (KV) file format or share it with your teammates.
Watch more tutorials on YouTube: