The engagement report gives you insights on how active visitors are on your site. It tells you how often they visit, how long they stick around and how much they interact with your content. Here are the three subreports you’ll find in the report:
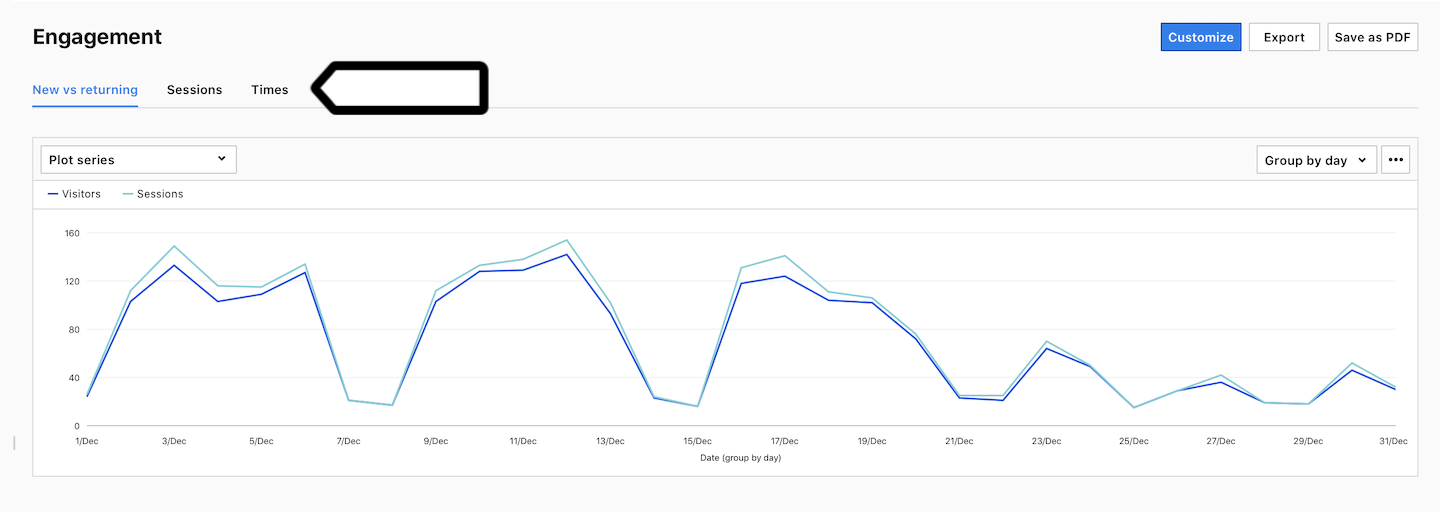
1. New vs returning: This report compares new visitors with the ones who’ve been to your site before. It may also show returning customers who’ve made purchases in your store, but only if you’re using our ecommerce tracking.
2. Sessions: This report provides more detailed stats about visitor sessions on your site.
3. Times: This report shows you the busiest times on your site.
To view the report, follow these steps:
1. Go to Menu > Analytics.
2. Navigate to Reports.
3. On the left, click Engagement.
4. All done! You can now view the report.
5. (Optional) Click a subreport name to view it.
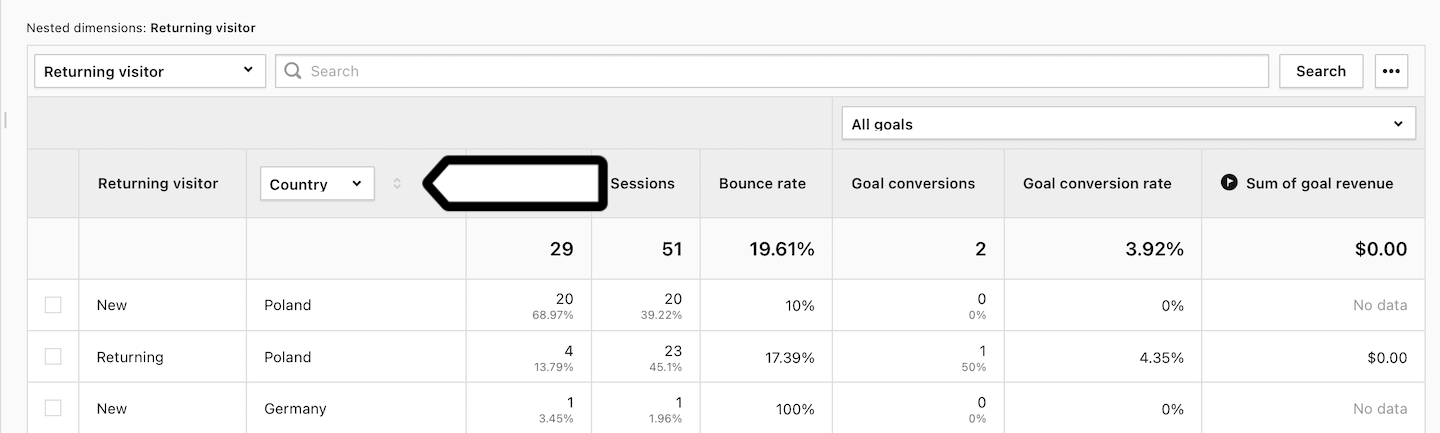
6. (Optional) If you want to see two dimensions in a single view, click + and choose a dimension.
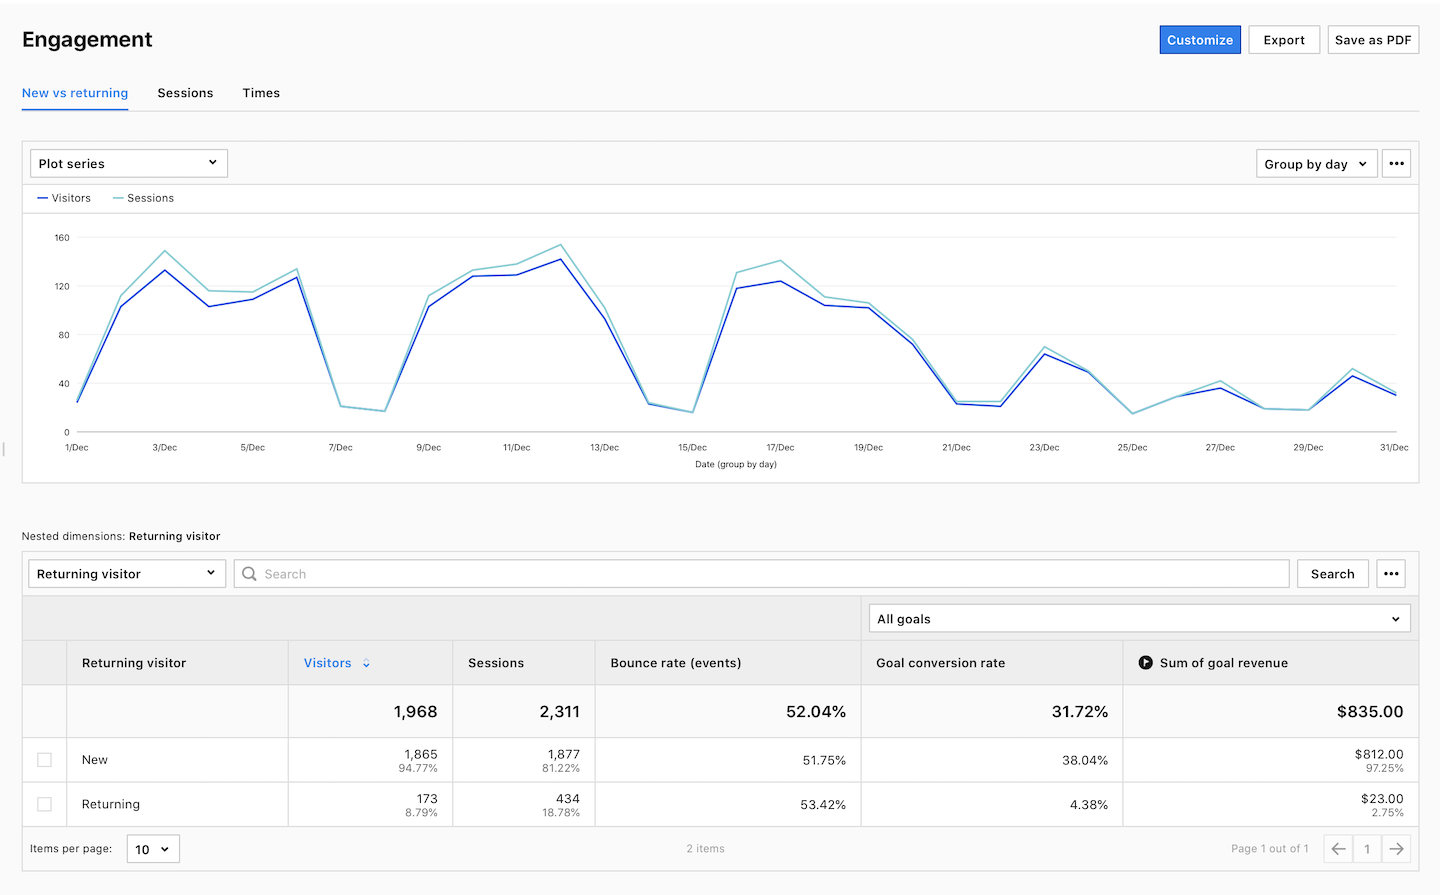
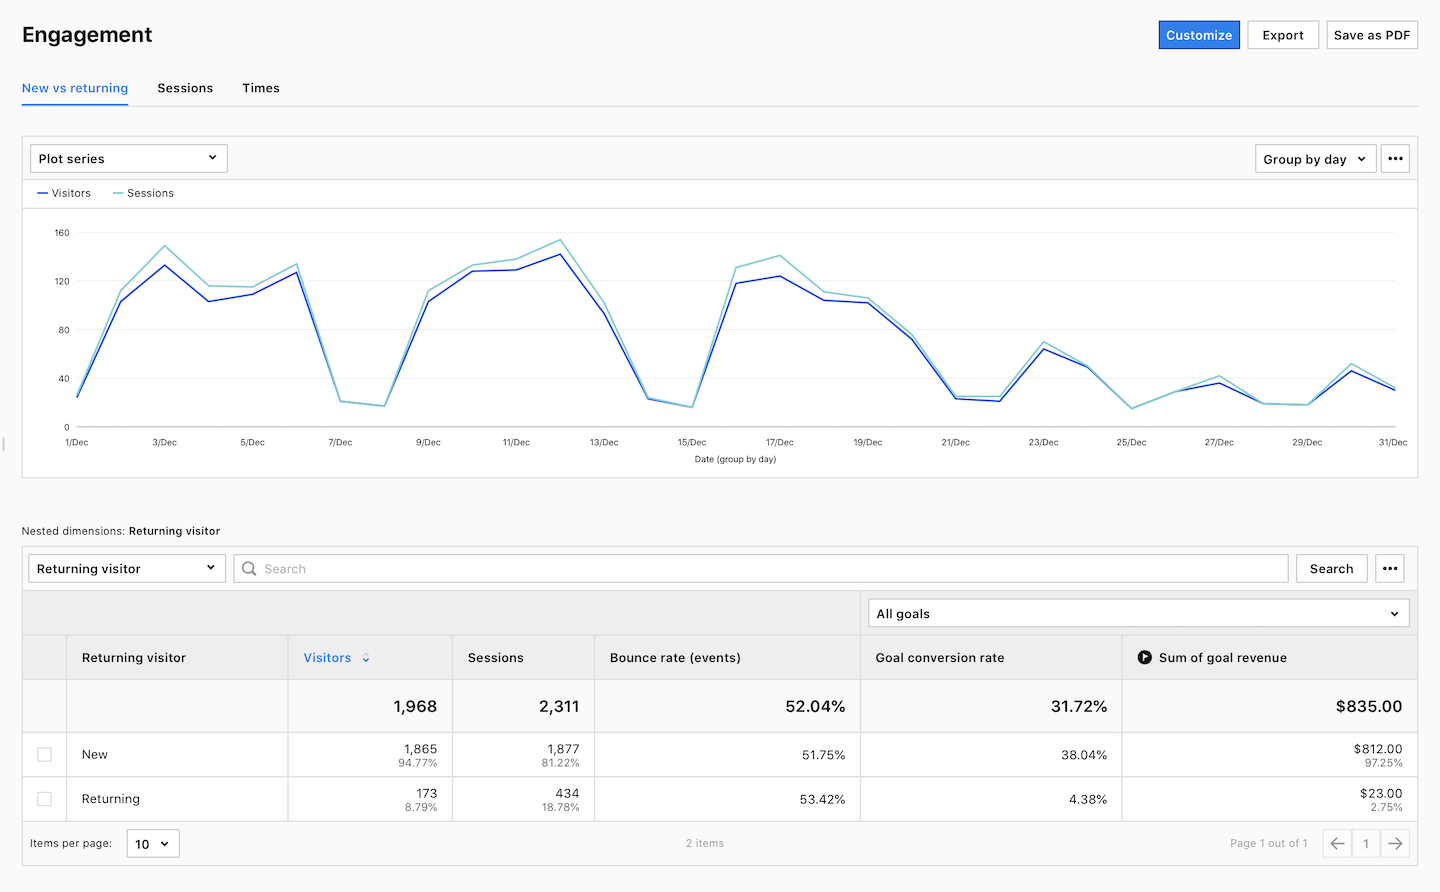
New vs. returning visitors
The new vs. returning report gives you a breakdown of how many first-time visitors and returning visitors come to your site. If you’re using our ecommerce tracking, it can also show you the number of returning customers who have made purchases. This report helps you see how well your marketing efforts bring in new customers and how good your business is at getting people to come back for more.
Note: Data in this report can be inaccurate when:
- You use a consent form and some visitors don’t consent. If they are tracked anonymously, each session will be counted as new and you will see a much higher number of new visitors. (Read more about privacy options and how they affect data collection.)
- If a visitor is first recognized as a new visitor and then as a returning visitor in a given time period, they will be counted in both categories. So if you add up new and returning visitors, you’ll get a higher number than the actual number of visitors. However, the total number of visitors that we show in this report is the actual number of visitors.
Note: Learn more about new visitors, returning visitors and returning customers.
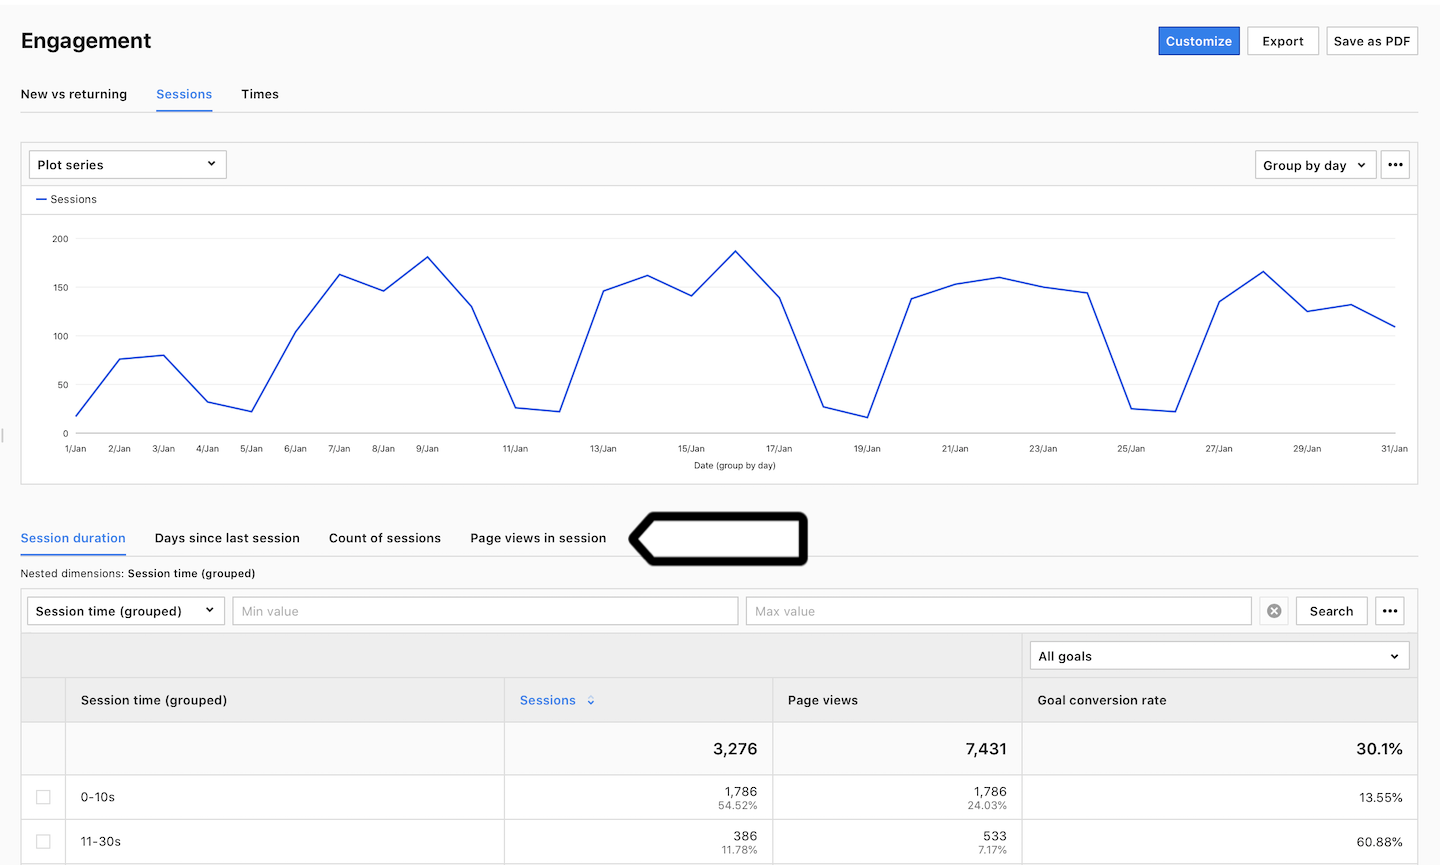
Sessions
This report groups data about sessions and shows how active visitors are during their visits. In this report, you can see the following sections:
- Session duration: This section tells you how long people stay on your site during their visits.
- Days since last session: This section shows you how quickly people return to your site. It tells you the number of days that have passed since visitors’ previous visits, giving you an indication of how often they come back.
- Count of sessions: This section tells you how frequently visitors engage with your website by counting the total number of their visits.
- Page views in session: This section gives you insights into how engaged visitors are by measuring the average number of pages visited per visit.
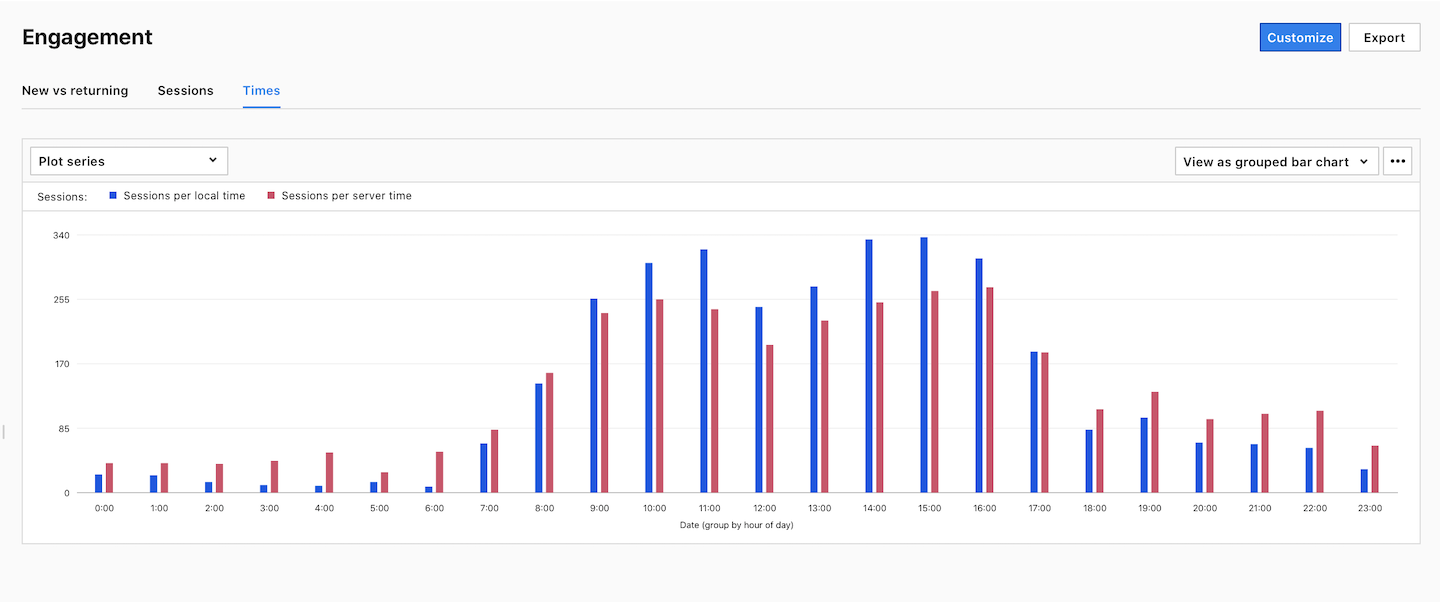
Times
This report gives you insights into when your site gets the busiest. Rush hours are like prime opportunities to send out newsletters or run pop-up campaigns. On the flip side, peaceful hours are perfect for doing some site maintenance.
The report provides data for two different time zones:
- Sessions per local time: The time in the time zone of the visitor’s browser.
- Sessions per server time: The time of your datacenter server’s time zone.
Metrics in the report
The table below describes the metrics you’ll find in your engagement report.
| Metric name | Description |
|---|---|
| Visitors |
The number of unique visitors. Every visitor is counted once, even if they visit the website many times during the day. Note: Learn more about visitors. |
| Sessions |
The number of sessions performed by visitors. A session starts with the first event and ends 30 minutes after the last event performed in that session. Note: Learn more about sessions. |
| Bounce rate |
The percentage of sessions in which visitors only viewed one page and didn’t proceed to another page, goal conversion or order. Note: Learn more about bounce rate |
| Goal conversion rate |
The percentage of sessions in which visitors completed a goal. Note: You need to set goals to collect this data. |
| Sum of goal revenue |
The amount of revenue generated by a goal. Note: You need to set goals to collect this data. |
| Page views | The number of times a page was visited. |
| Average session time | The average duration of a session measured from the first to the last event during a visit. |
Note: You can customize this report, apply segments to it, export it to a CSV, XML, JSON or JSON (KV) file format or share it with your teammates.
Watch more tutorials on YouTube: