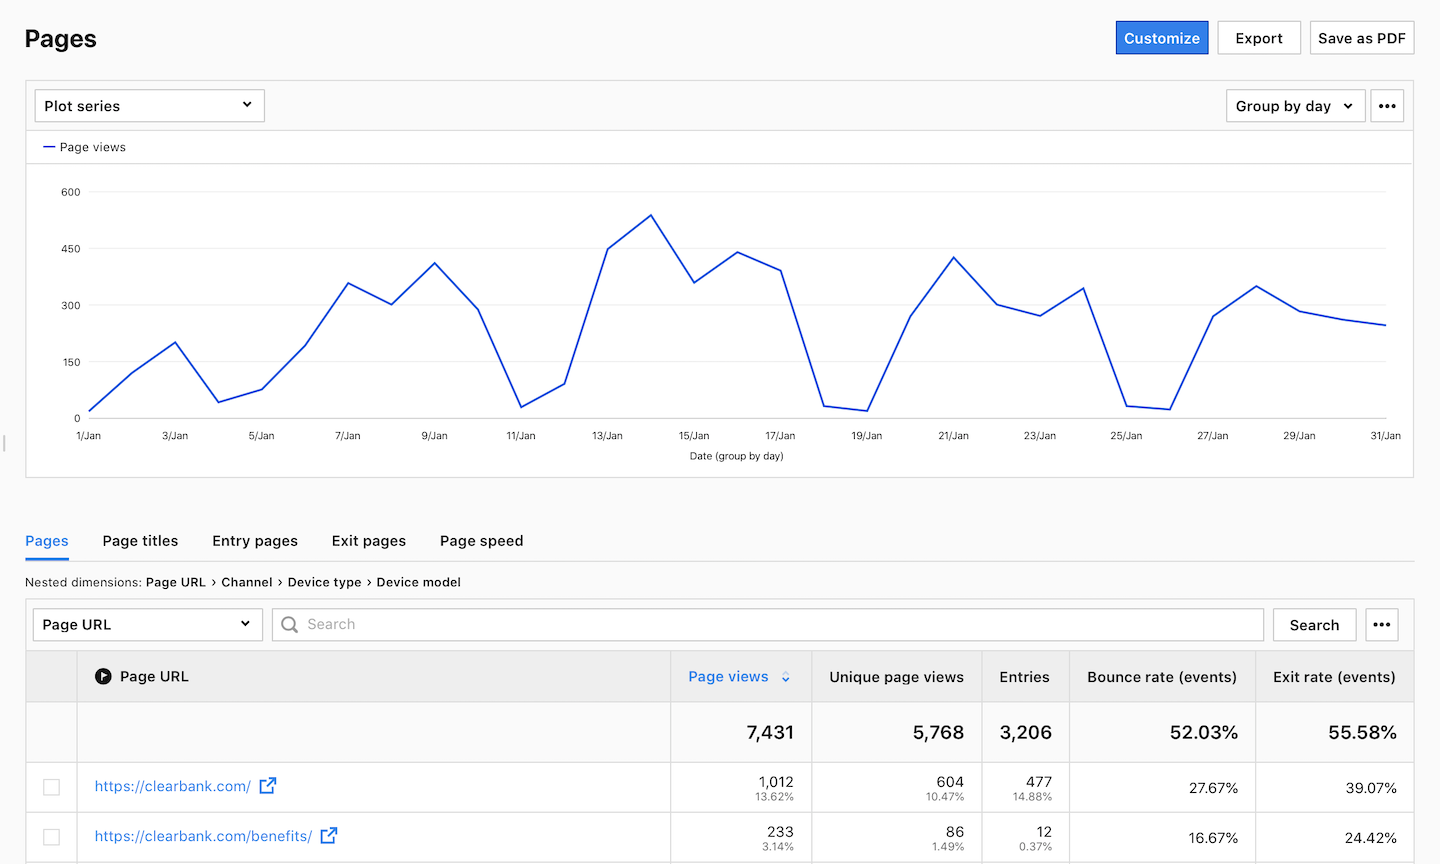
The page report uncovers how traffic is distributed across your site. It’s a report that you’ll likely spend a significant amount of time examining, as it highlights the content that is most popular among your visitors.
The report is based on two key elements that describe a web page: the page URL and the page title. Most pages have a unique title, although there might be cases where multiple pages share the same title. For example, all broken links may have the same page title, such as a 404 error page. On the other hand, the page URL is always unique for each web page. So, as you review the reports, it’s important to note that there may be differences between these two categories.
To view the report, follow these steps:
1. Go to Menu > Analytics.
2. Navigate to Reports.
3. On the left, click Pages.
4. Done! You can now view your report.
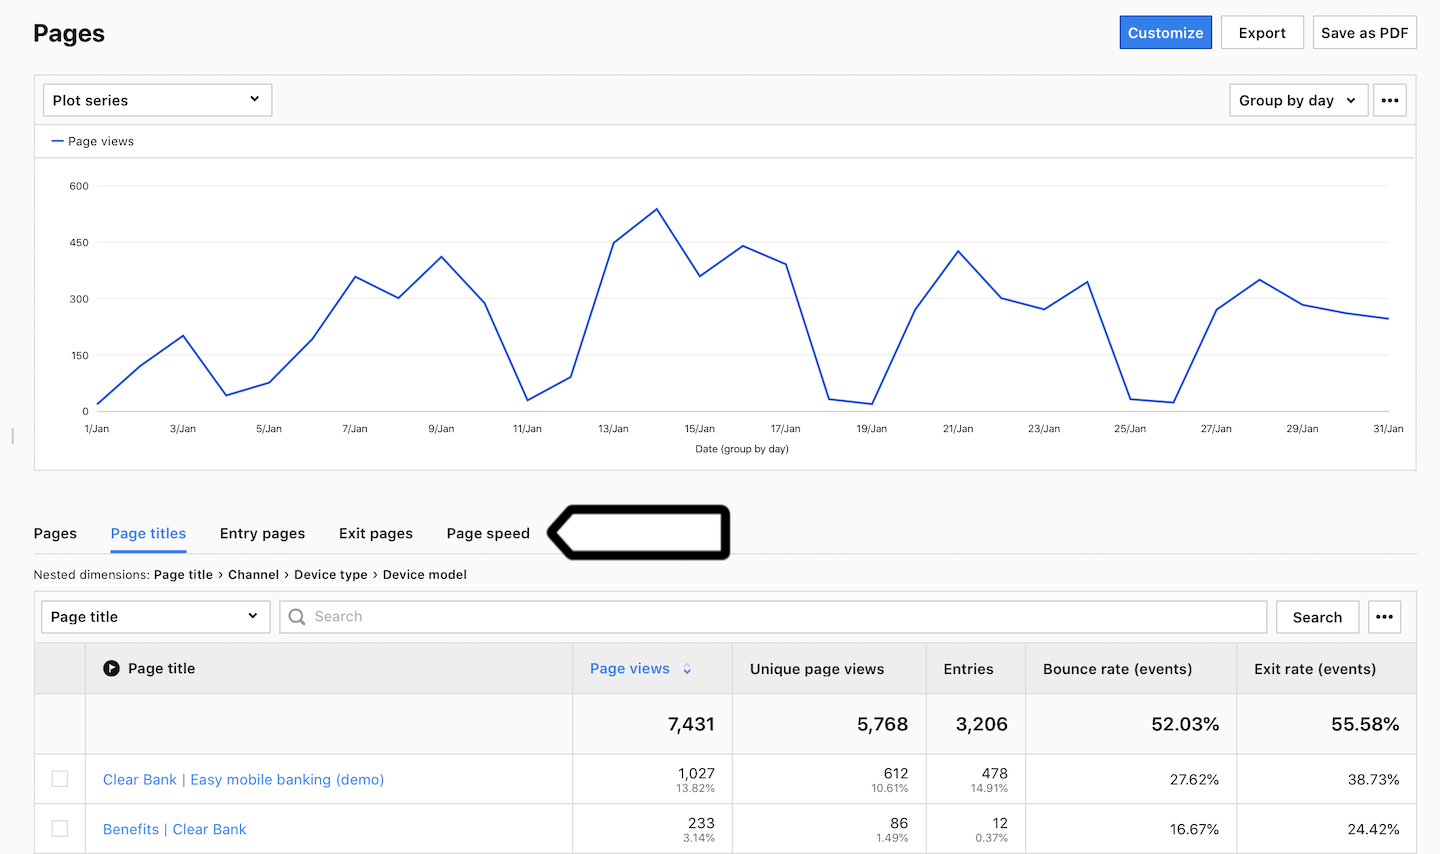
5. (Optional) Click a section name to view a specific section of this report.
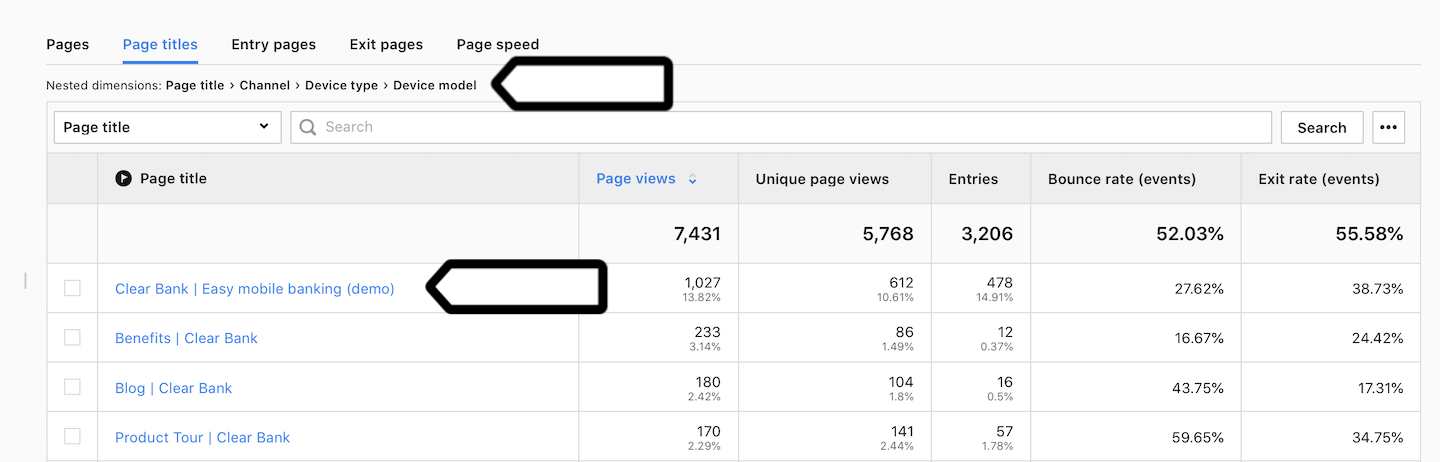
6. (Optional) If you come across a nested dimension in the report, simply click on the dimension to explore more detailed data.
7. (Optional) If you want to see two dimensions in a single view, click + and choose a dimension.
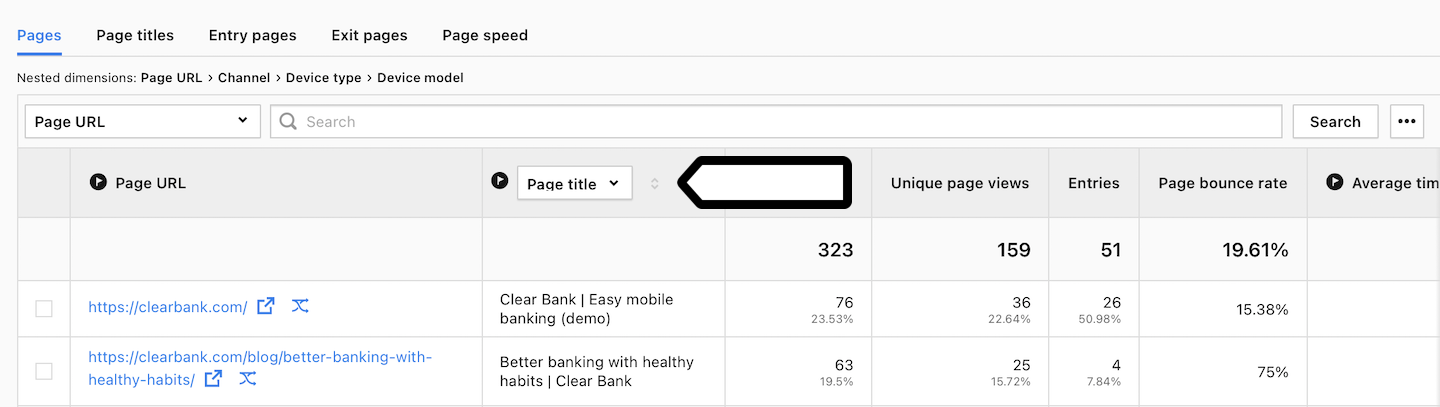
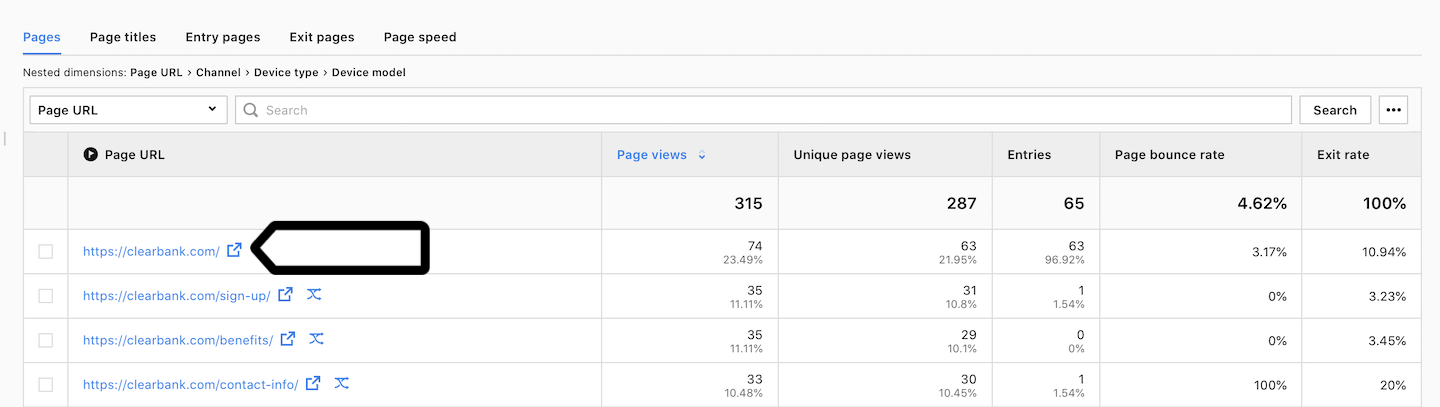
8. (Optional) Click the icon next to the link to open the page in your browser.
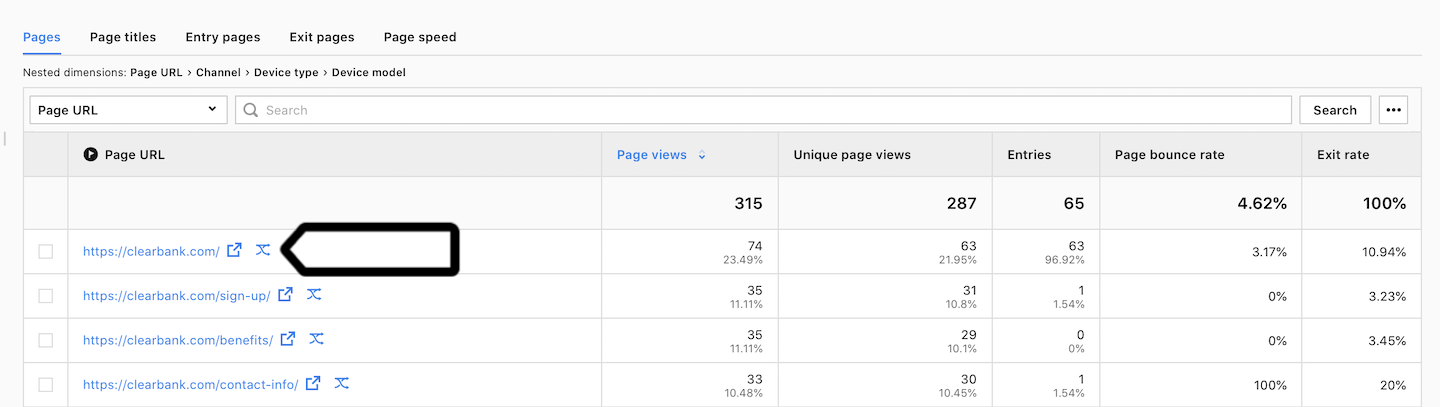
9. (Optional) Click the second icon next to the link to open the user flow for that page.
Sections in the report
The page report includes several sections that focus on different aspects of page performance. Here are the sections:
- Pages: This section displays page URLs along with information about the channel, device type and model. It helps you identify well-performing pages and analyze the traffic sources that lead visitors to those pages.
- Page titles: Here you can see the page titles along with details about the channel, device type and model.
- Entry pages: This section shows the first page visited by a visitor during their session, helping you to understand the entry points to your site.
- Exit pages: Here you can find the last page visited by a visitor during their session and thus analyze exit points from your site.
- Page speed: This section provides data on the average generation time of each page. It allows you to examine how quickly pages load in visitors’ browsers. For a more detailed report on page speed, see the page timing report.
Metrics in the report
The tables below describe the metrics you’ll find in your page report.
Page and page title section
| Metric name | Description |
|---|---|
| Page views | The number of times a page was visited. |
| Unique page views | The number of unique visits to the page. If a visitor views the page several times during one session, the page view will be counted only once. |
| Entries | The number of views of the first page displayed during a session. |
| Page bounce rate |
An accurate bounce rate for a page URL or page title. The percentage of sessions in which visitors only viewed that page and didn’t proceed to another page, goal conversion or order. Note: Learn more about bounce rate |
| Exit rate | The percentage of sessions that ended on the selected page. Exit rate = Exits / Sessions * 100% |
Entry page section
| Metric name | Description |
|---|---|
| Entries | The number of views of the first page displayed during a session. |
| Page bounce rate |
An accurate bounce rate for a page URL or page title. The percentage of sessions in which visitors only viewed that page and didn’t proceed to another page, goal conversion or order. Note: Learn more about bounce rate |
| Exit rate | The percentage of sessions that ended on the selected page. Exit rate = Exits / Sessions * 100% |
| Page views | The number of times a page was visited. |
| Unique page views | The number of unique visits to the page. If a visitor views the page several times during one session, the page view will be counted only once. |
| Goal conversion rate |
The percentage of sessions in which visitors completed a goal. Note: You need to set goals to collect this data. |
| Sum of goal revenue |
The amount of revenue generated by a goal. Note: You need to set goals to collect this data. |
Exit page section
| Metric name | Description |
|---|---|
| Exits | The number of views of the last page displayed during a session. |
| Sessions |
The number of sessions performed by visitors. A session starts with the first event and ends 30 minutes after the last event performed in that session. Note: Learn more about sessions. |
| Exit rate | The percentage of sessions that ended on the selected page. Exit rate = Exits / Sessions * 100% |
| Unique page views | The number of unique visits to the page. If a visitor views the page several times during one session, the page view will be counted only once. |
Page speed section
| Metric name | Description |
|---|---|
| Average page generation time | The average time it takes for the page to load on the visitor’s device. |
| Page views | The number of times a page was visited. |
| Page bounce rate |
An accurate bounce rate for a page URL or page title. The percentage of sessions in which visitors only viewed that page and didn’t proceed to another page, goal conversion or order. Note: Learn more about bounce rate |
| Goal conversion rate |
The percentage of sessions in which visitors completed a goal. Note: You need to set goals to collect this data. |
| Sum of goal revenue |
The amount of revenue generated by a goal. Note: You need to set goals to collect this data. |
Note: You can customize this report, apply segments to it, export it to a CSV, XML, JSON or JSON (KV) file format or share it with your teammates.
Watch more tutorials on YouTube: