Once you have defined goals for your website, you may start wondering how exactly visitors reach each particular goal. Is there a familiar path that visitors take to arrive at the signup page? And what happens when they go through the signup process? Do all visitors complete the signup? And if not, why do they quit?
There are no simple answers to these questions, but we do have tools that can shed some light on how people reach goals and what happens along the way. User flow and funnel reports are these tools.
Set up a user flow report
A user flow report shows you how people move through your website. You can set a key interaction and see previous and next interactions. The report can be set as three types:
- Standard report: Shows the key interaction and the next interactions.
- Transition report: Shows the key interaction and the previous and next interactions.
- Reverse report: Shows the key interaction and the previous interactions.
For our case, we’ll use a reverse report because we’d like to see the pages visitors went through before they reached a signup page. The reverse report will analyze all routes visitors took and deliver a report showing well-worn paths.
To set up a reversed user flow report, follow these steps:
1. Go to Menu > Analytics.
2. Navigate to Custom reports.
3. Click Add a report.
4. Select the following report type: User flow.
5. Name the report.
6. In Visibility, choose Author or All users. All users lets you share this report with your teammates.
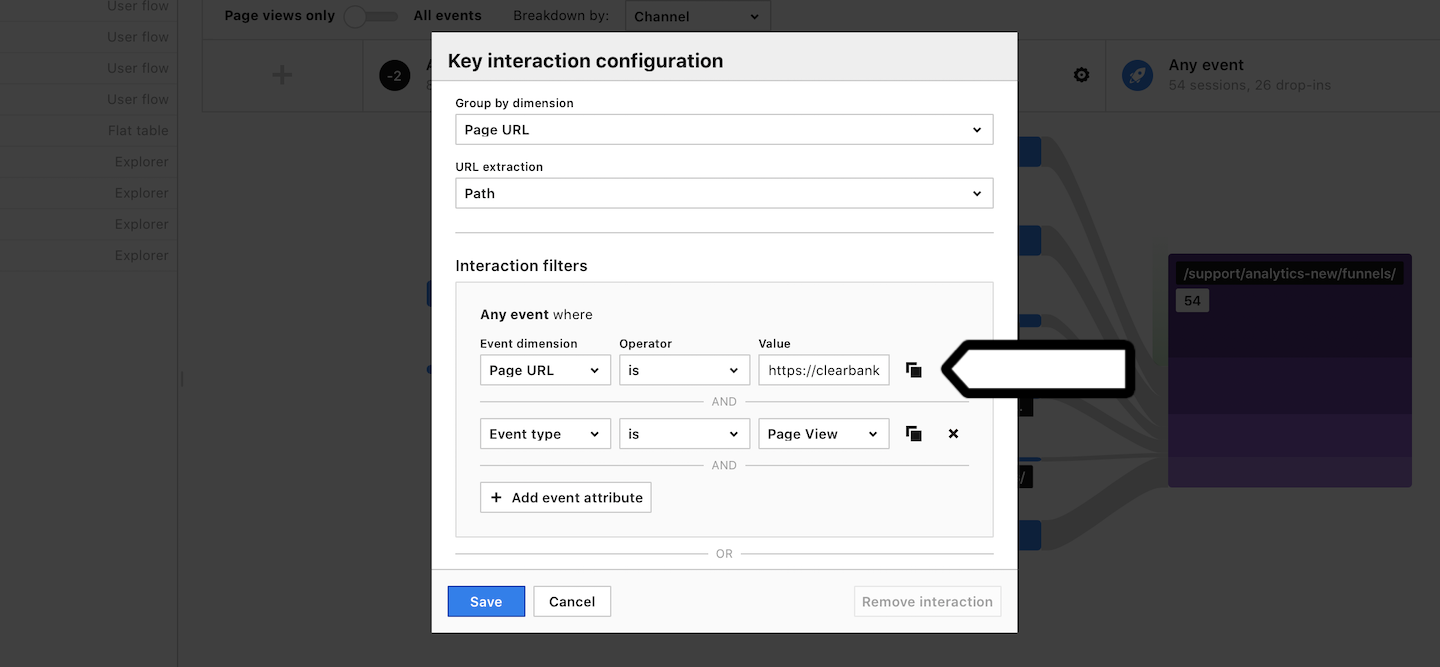
7. Click the ⚙ setting icon next to the key interaction.
8. Set up conditions for the key interaction. Example: Page URL is https://clearbank.com/sign-up/.
9. On the left, click + to add previous interactions.
10. (Optional) Set up conditions for the previous events. In our case, we’ll leave interactions as page views because we want to see only pages leading to the signup page.
11. Click Save.
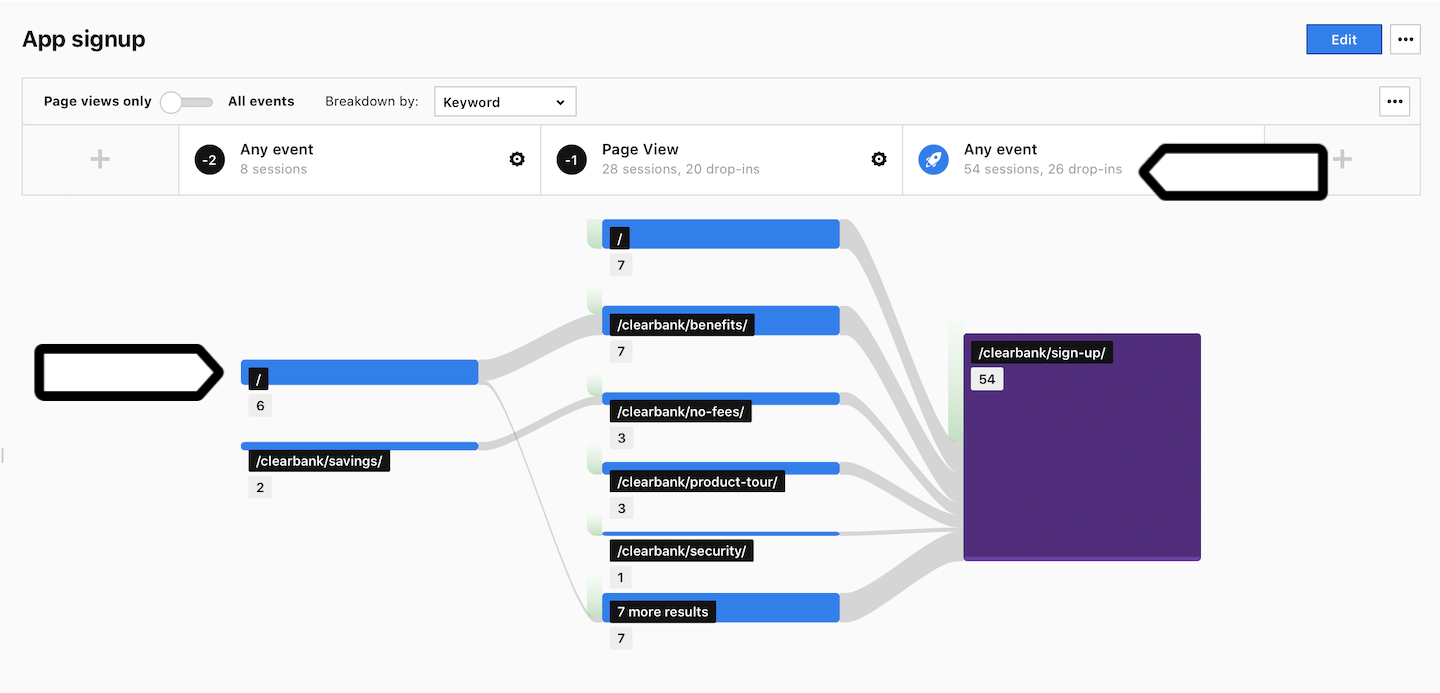
12. All done! Now you can start working with your report. And let’s look at our example:
- -2 interaction: 8 sessions have been recorded
- -1 interaction: 20 sessions dropped in
- Key interaction: 26 sessions dropped in
- Top paths:
/–>/clearbank/benefits/–>/clearbank/sign-up/and/–>/clearbank/sign-up/.
Tip: To add filters to a user flow report, go to Edit > Flow filters.
By studying the data in a user flow report, you can discover which path leads to the most conversions. This information can help you design a more effective website for your visitors, which in turn can improve your business goals.
Set up a funnel report
A funnel is another tool you can use in addition to a user flow report. The funnel helps you understand how people move along a specific path and where they drop off. For example, you can see how visitors go through the signup process and find out where they decide to leave.
To set up a funnel report, follow these steps:
1. Go to Menu > Analytics.
2. Navigate to Custom reports.
3. Click Add a report.
4. Select the following report type: Funnel.
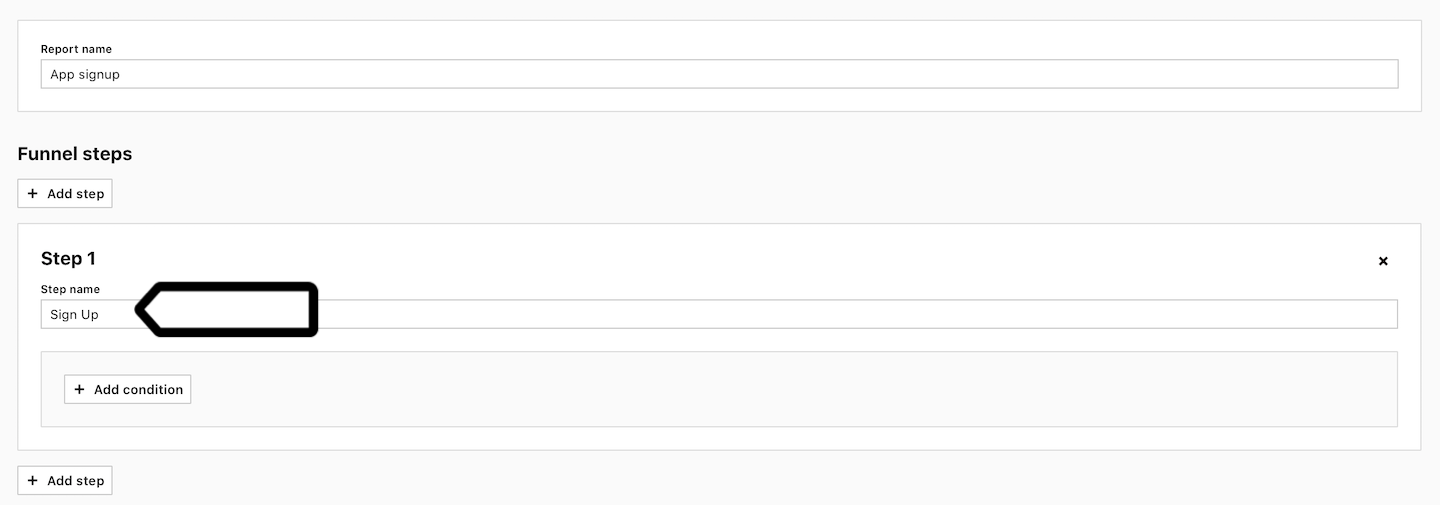
5. Name the report.
6. In Visibility, choose Author or All users. All users lets you share this report with your teammates.
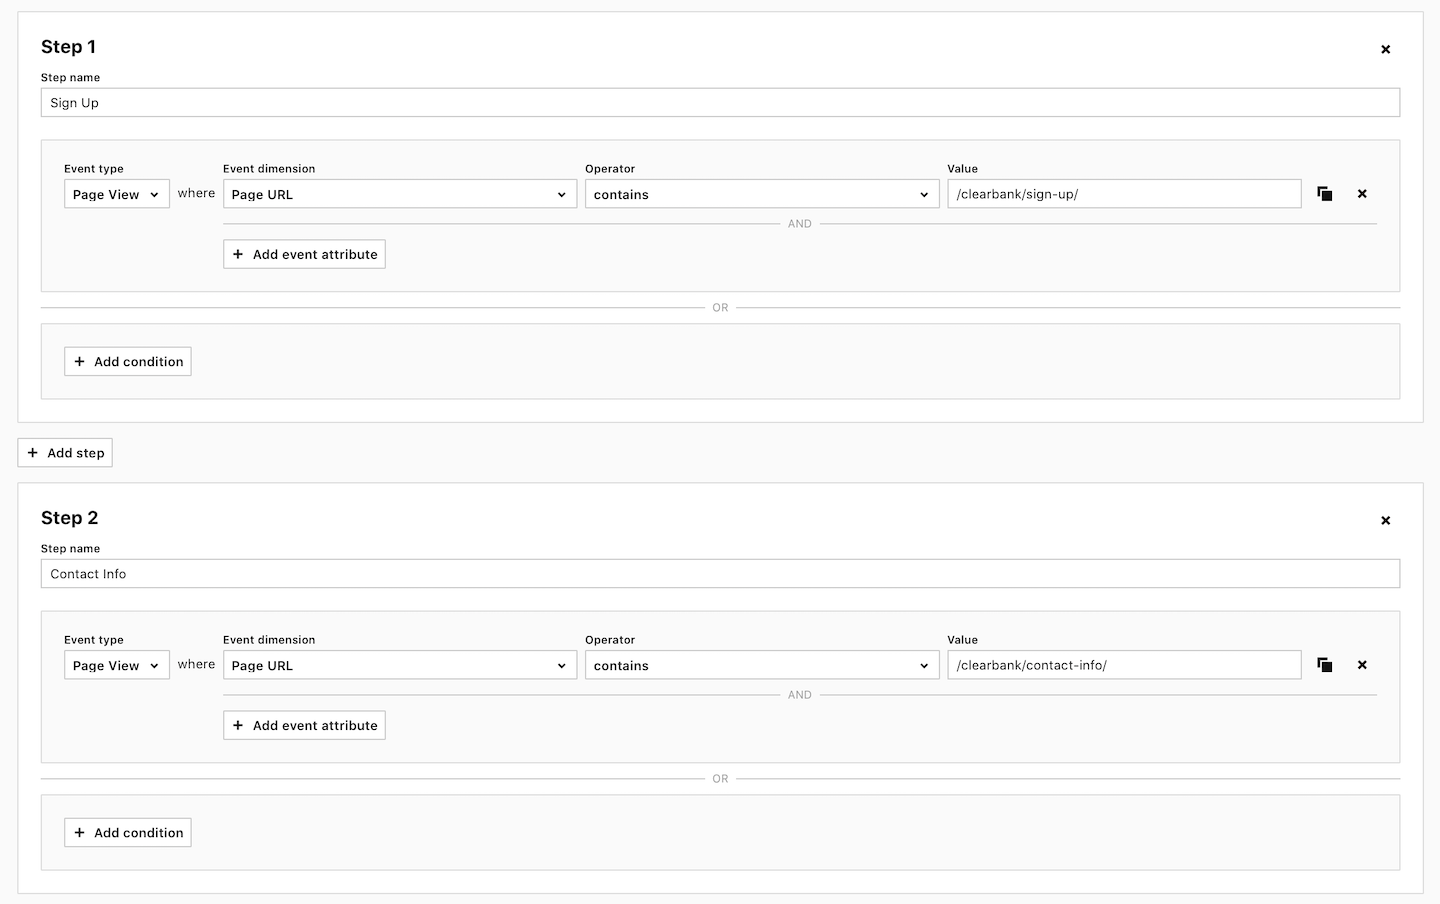
7. Name the first step.
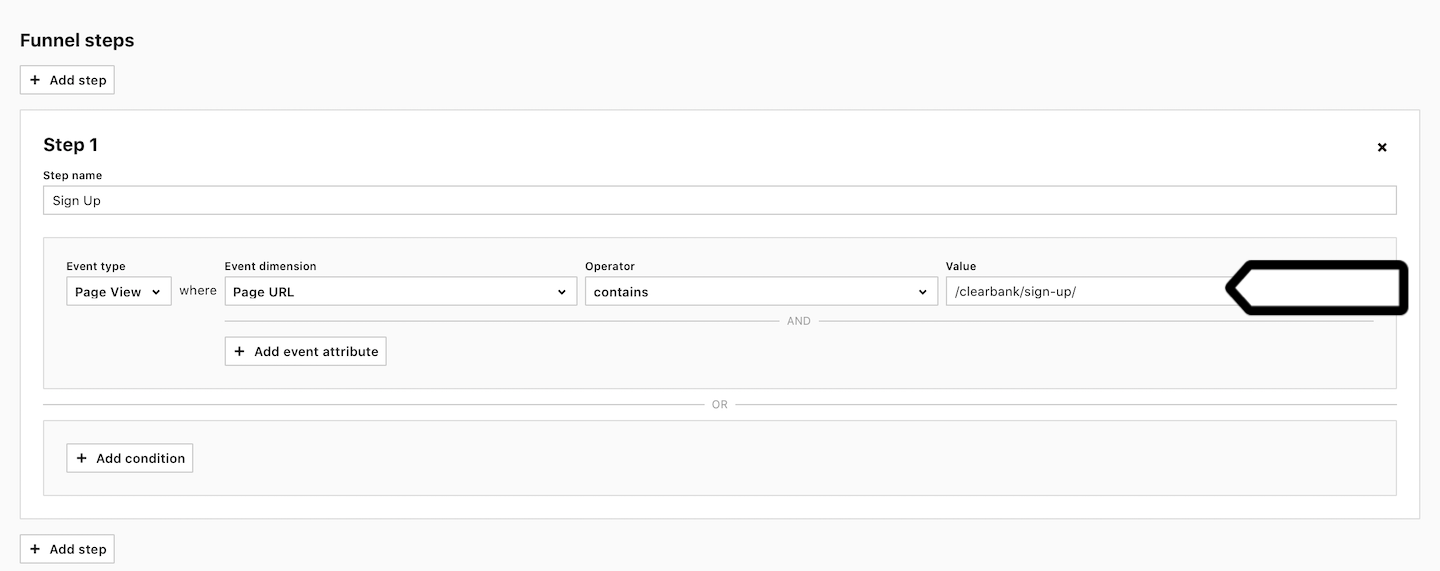
8. Click + Add condition.
9. Select an event type. Example: Page view.
10. Define conditions for this step. Example: Page URL contains /clearbank/sign-up/.
11. Click + Add step and define conditions for the second step.
12. Add more steps to the funnel.
13. (Optional) Set funnel filters. Example: We use the condition Coutry is New Zealand to filter out people from that country.
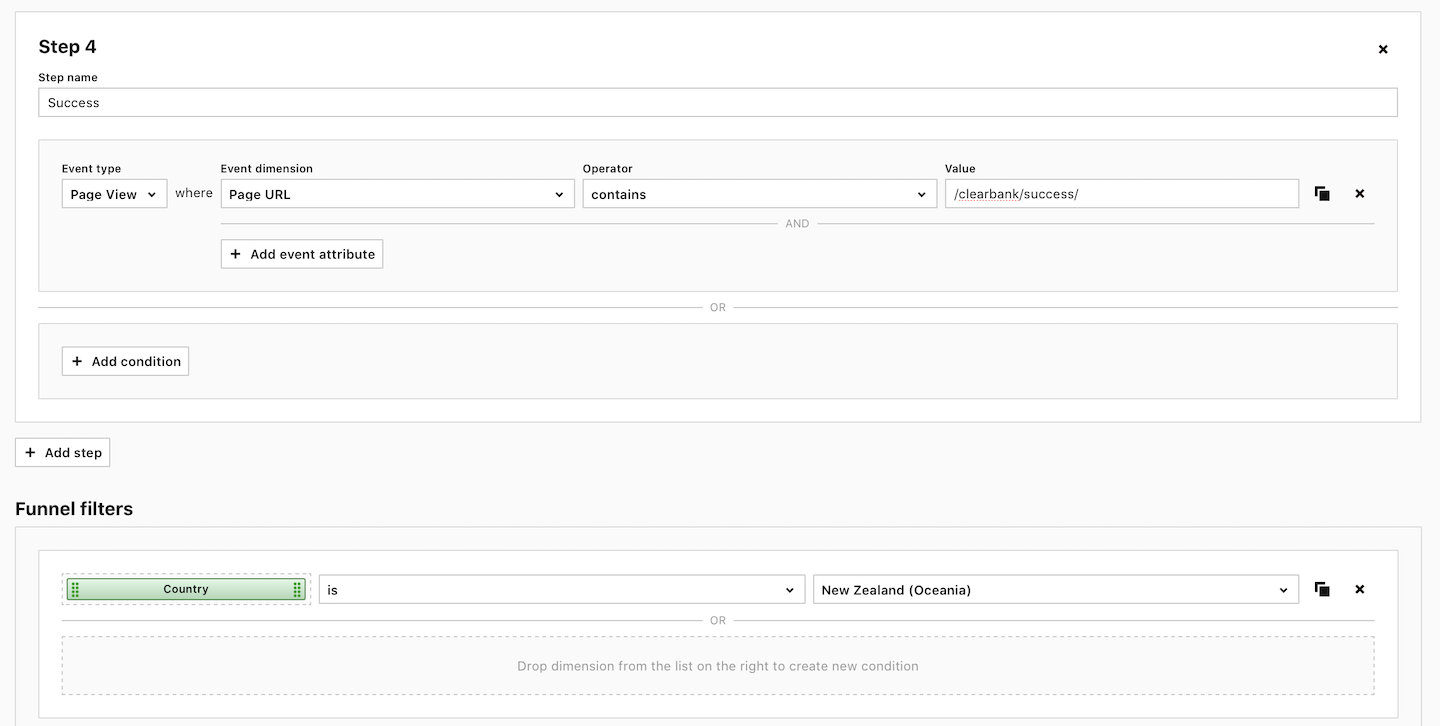
14. When it’s all set, click Save.
15. Complete!
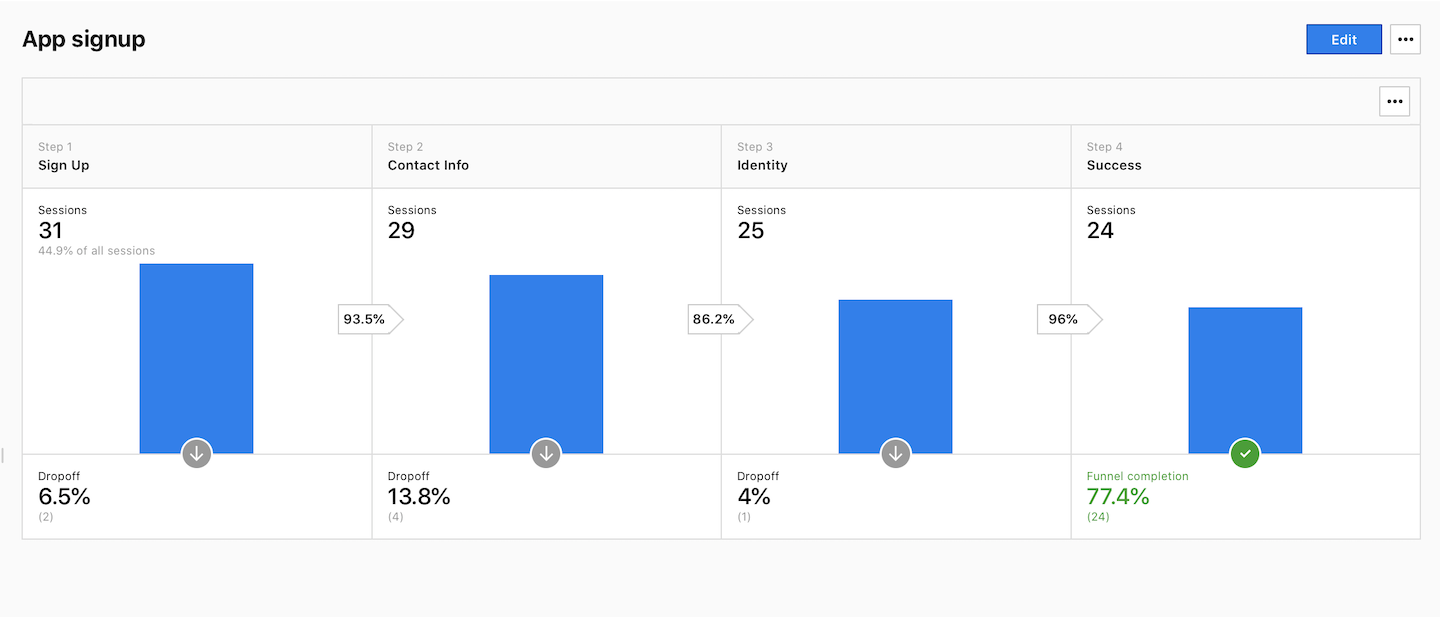
After you set up the funnel, Piwik PRO will show you the data it collected in a funnel report. The funnel will work for past data, but only if events used as funnel steps have been tracked. Keep in mind that while page views are automatically tracked, custom events need to be set up separately. So when designing your funnel, remember to track all necessary steps.
To view the funnel report, follow these steps:
1. Go to Menu > Analytics.
2. Navigate to Custom reports.
3. On the left, select the funnel report you want to work with.
4. You’re all set with your report!
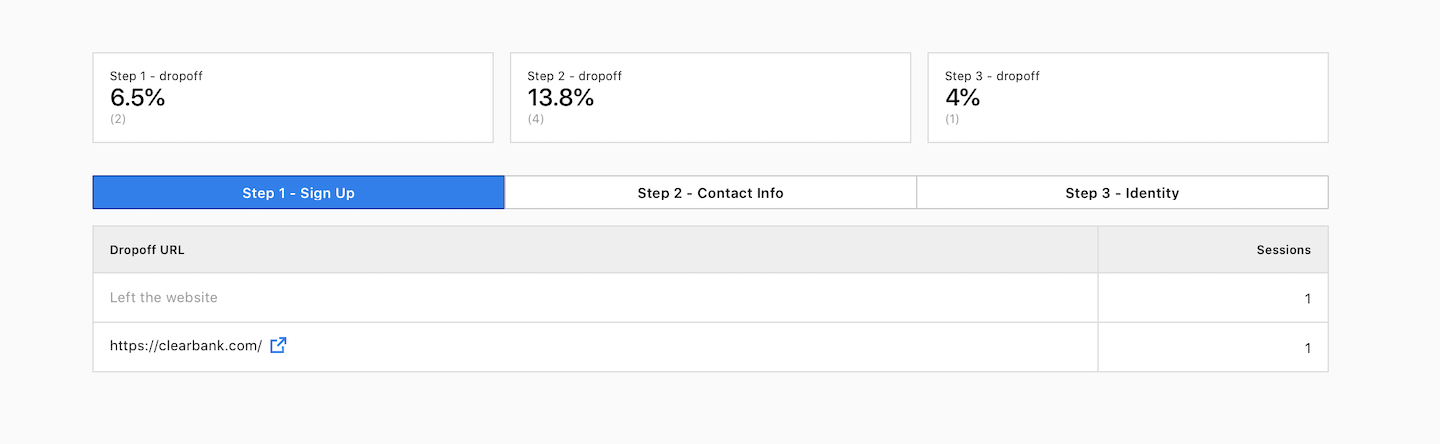
5. Click the drop-off section at the bottom of a step.
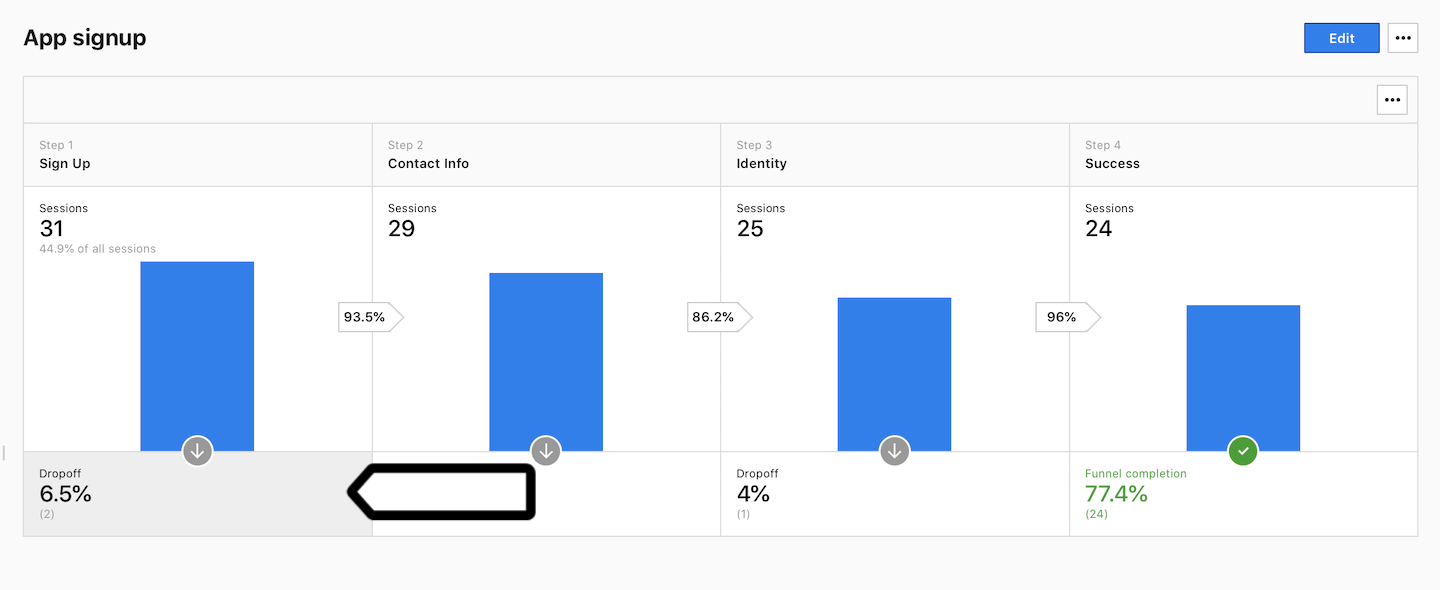
6. You’ll see the drop-off report, which will show you the drop-off rate for each step and where people are going after leaving the funnel.
A bit more about funnels
We’ve shown you an example of tracking the signup process, which is a defined path. It leads only from A to B to C to D. But you can set up a funnel for a different path and set steps that are not predefined. For example, you may want to see a funnel for reaching a pricing page. There are various routes people can take to arrive at this page. So before you create a funnel you can analyze a user flow report to see what is a popular route. You can select the one that is most commonly followed, and use it as the baseline for the steps in your funnel. The only thing that remains is analyzing all the data, drawing conclusions and planning improvements. We’re sure you’re a master at doing that!