So far, you’ve learned how to track a click on a button, menu with logo and footer items. Now is a good moment to shed some light on how much content visitors consume. Scroll depth is one of the metrics that will help you with that.
Piwik PRO tracks page scrolls automatically and saves scroll data as custom events. To see how far visitors scroll on a given page, you need to set up a custom report. Let’s do it right away.
Set up reporting for page scrolls
To set up reporting for page scrolls, follow these steps:
1. Go to Menu > Analytics.
2. Navigate to Custom reports.
3. Click Add a report.
4. Choose the following report type: Explorer.
5. Name the report. Example: Page scrolls.
6. In Visibility, choose Author or All users. All users lets you share this report with your teammates.
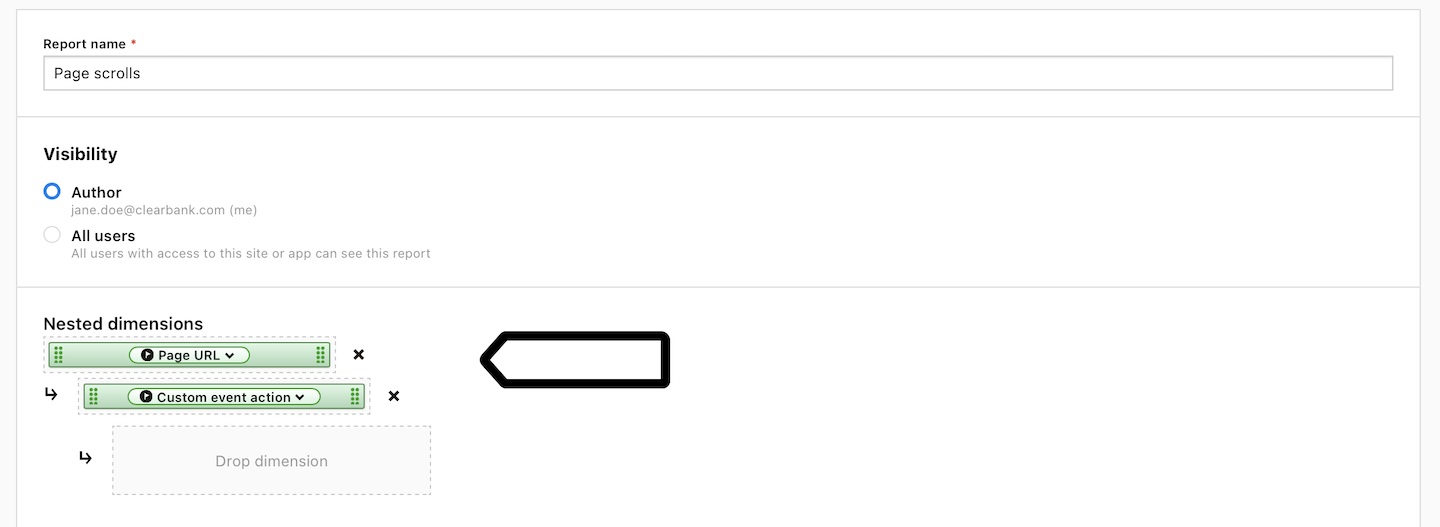
7. In Nested dimensions, set the following dimensions:
- Page URL
- Custom event action
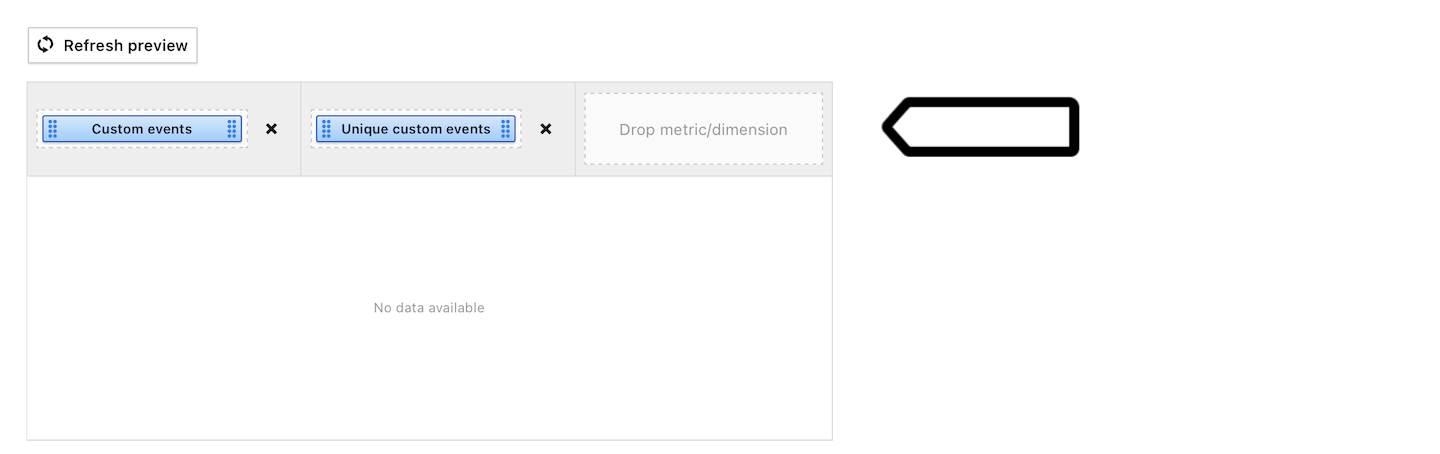
8. Add the following metrics:
- Custom events
- Unique custom events
9. (Optional) Set Default sorting options.
Tip: Default sorting makes the data appear in your report in a specific order based on the selected dimension or metric.
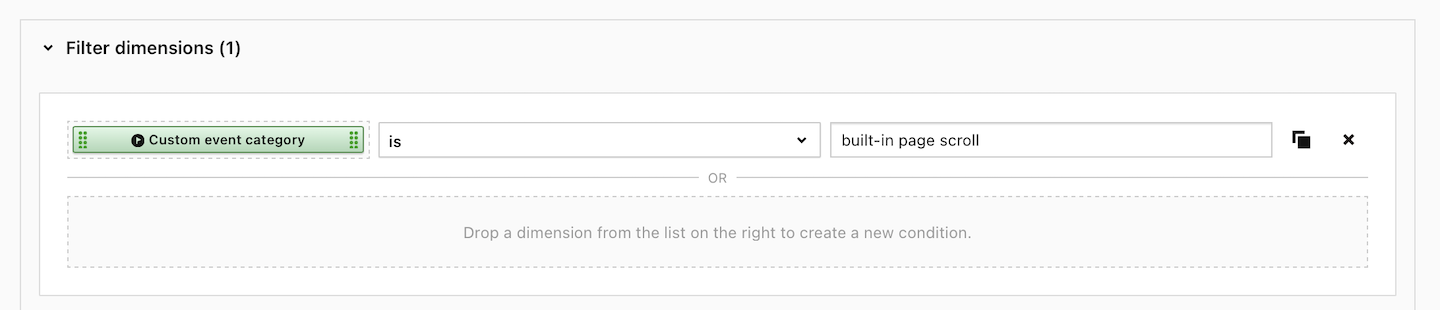
10. In Filter dimension, set the following filter: Custom event category is built-in page scroll.
11. Click Save.
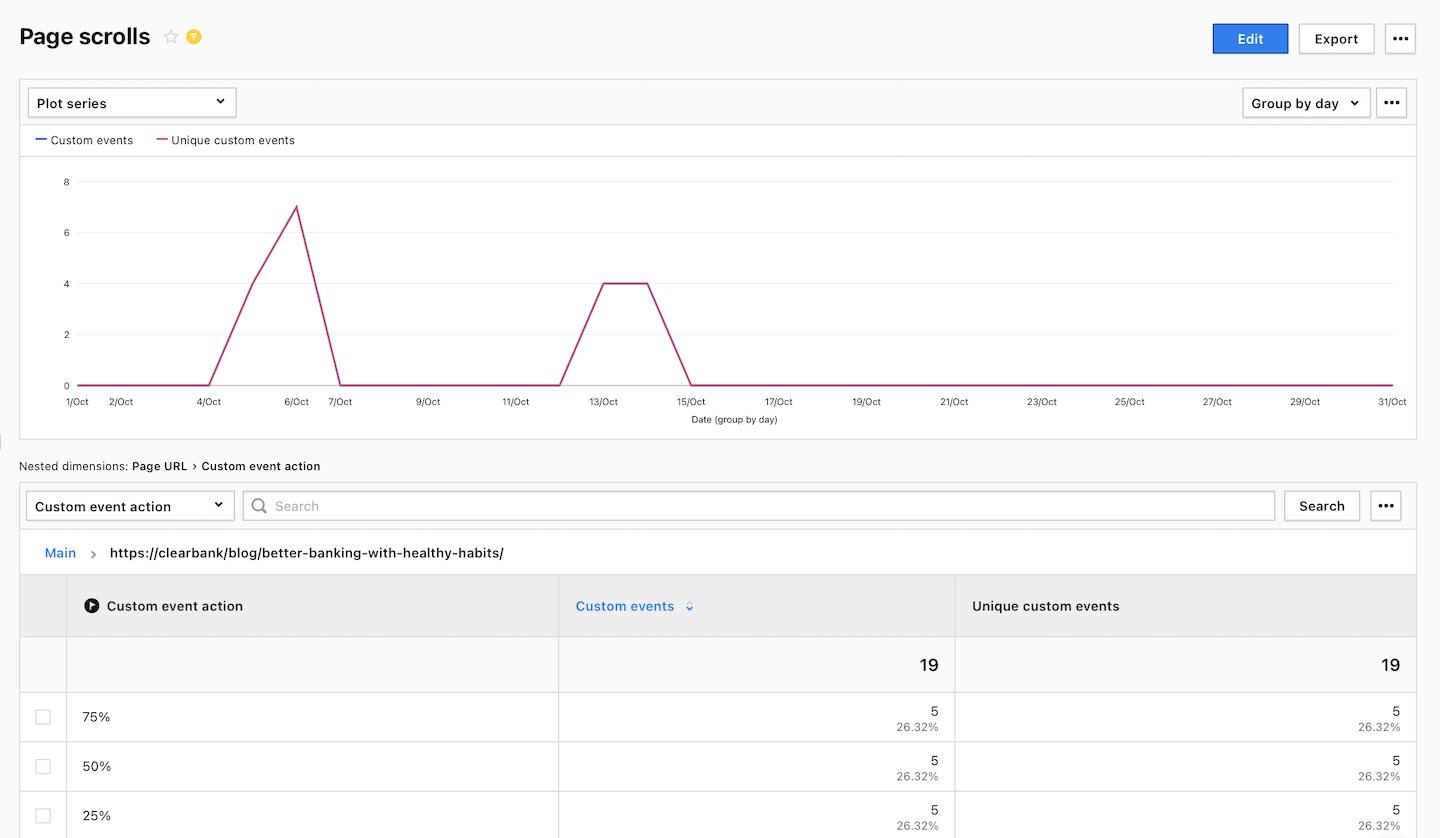
12. All done! Now click on a page URL in your report to see how far visitors scroll on that page.
How to analyze scroll data
It’s best to analyze scroll data for each page, not for all pages. It’s because each page has different content and a different goal. For example, on the Clear Bank’s website we could look at scroll depth for blog posts to understand how far down people are reading. Additionally, we could analyze scroll depth for the home page and pages with our offer to learn which information is the most visible to visitors.
At this point, we need to explain how to read the data. Our report will show the number of events for each scroll point. For example:
- 50 events of 25% scroll
- 20 events of 50% scroll
- 10 events of 75% scroll
- 5 events of 100% scroll
But that doesn’t mean that 50 people scrolled to 25% and another 5 people scrolled to 100%. It means that:
- 30 people scrolled to 25%
- 10 people scrolled to 50%
- 5 people scrolled to 75%
- 5 people scrolled to 100%
Why? Because a person who scrolls to 100% is registered with four events: one for 25% mark, one for 50% mark, one for 75% mark and one for 100% mark. Here’s how to count it.
| Scroll point | Events | Visitors |
|---|---|---|
| 25% scroll | A | A-B |
| 50% scroll | B | B-C |
| 75% scroll | C | C-D |
| 100% scroll | D | D |
Now let’s see this calculation for our example.
| Scroll point | Events | Visitors |
|---|---|---|
| 25% scroll | 50 | 50-20=30 |
| 50% scroll | 20 | 20-10=10 |
| 75% scroll | 10 | 10-5 |
| 100% scroll | 5 | 5 |
When we have scroll depth data ready, we can compare it to a few metrics calculated for the page we’re tracking: average time on page and bounce rate under Menu > Analytics > Reports > Pages. These two are the best indicators of how our content is performing. When beefed up with the scroll depth metric they work even better.