The Google Ads report tells you which Google Ads campaigns are driving people to your website. It combines Google Ads data with Piwik PRO data, including things like sessions, bounce rates and goal conversions. When you look at this report, you can easily see which campaigns are doing a good job of getting people to your site and making them happy customers.
Before you start
Here are a few things to know before you start:
- The Google Ads report only works if you’re integrated with Google Ads. If you’re not, follow the integration guidelines for Piwik PRO (cloud and private cloud) or Piwik PRO (on-premises).
- The integration will download campaigns supported by Google Ads API.
- If you want to create a custom report that combines data from Google Ads and Piwik PRO, be sure to check out the dimensions and metrics that can be combined.
- We recommend that you use auto-tagging in Google Ads. It allows Piwik PRO to combine data and show more accurate information in reports.
About the report
In Google Ads report, you’ll see eight subreports:
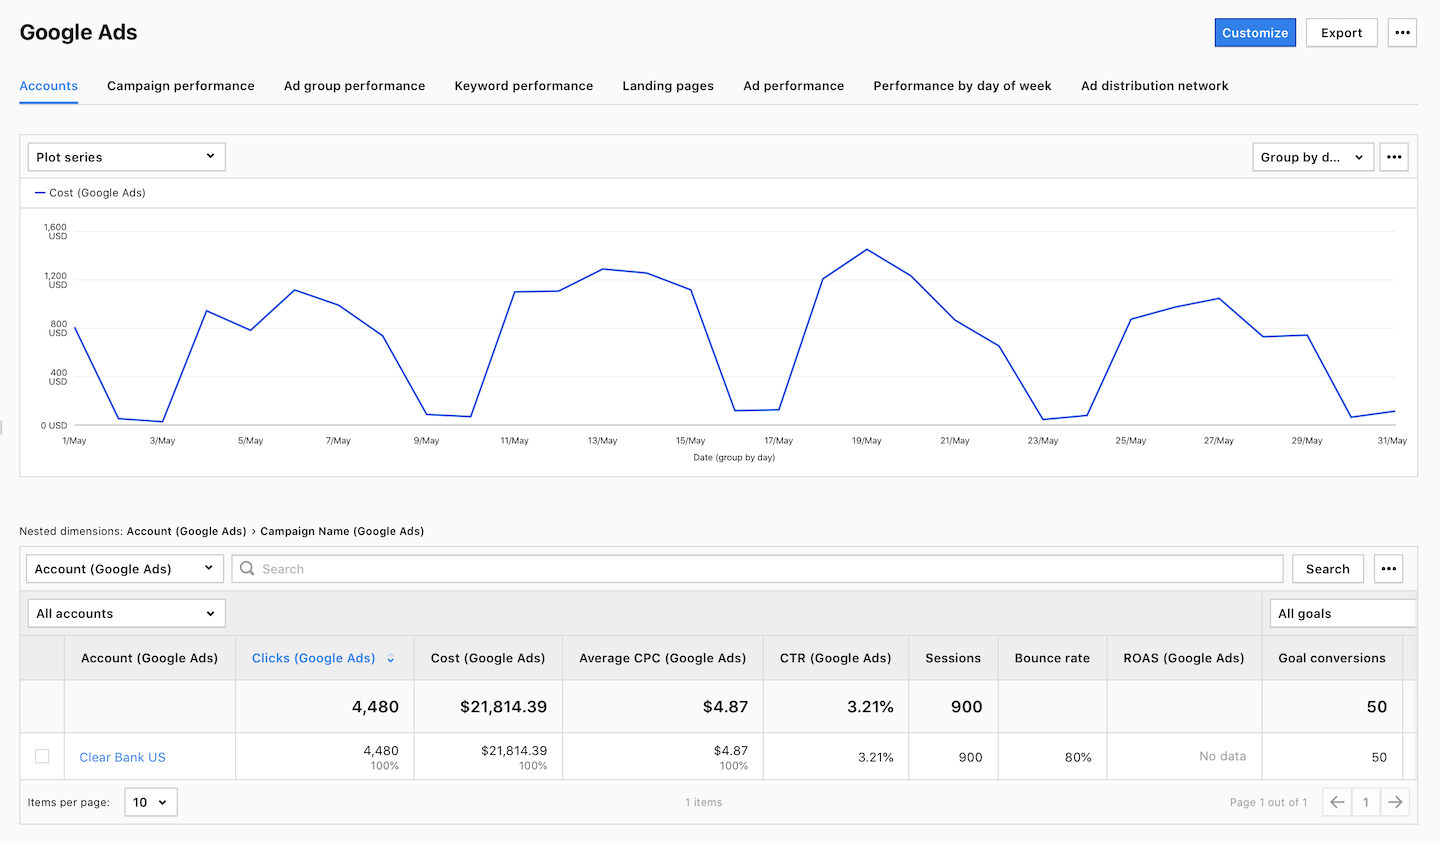
1. Accounts: This report displays the Google Ads accounts connected to your Piwik PRO site.
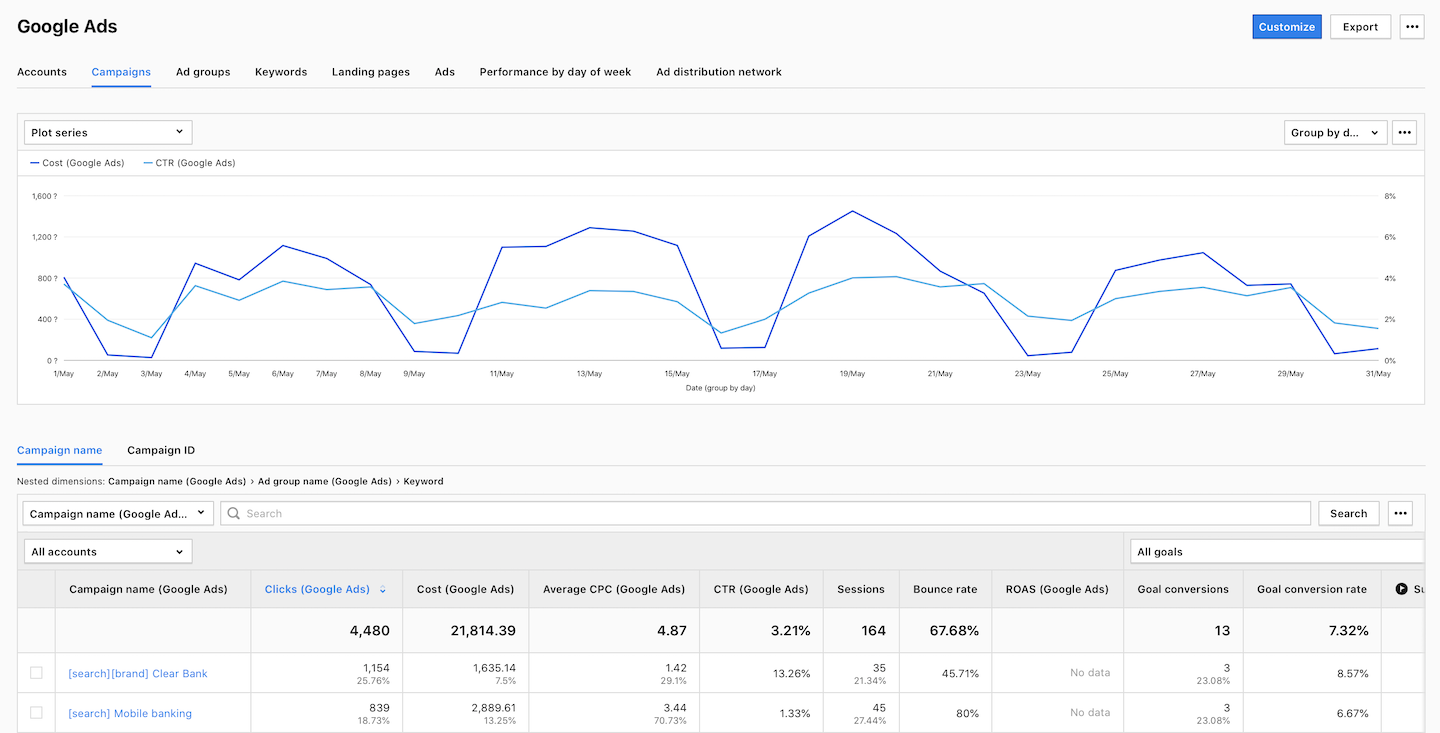
2. Campaign performance: This report shows the performance of the campaigns set up in Google Ads that bring traffic to your site.
3. Ad group performance: This report shows the performance of the ad groups set up in Google Ads that bring traffic to your site.
Note: Performance Max campaigns don’t support ad groups, so the data from these campaigns will be put under “no data” in this report.
4. Keyword performance: This report displays the performance of the keywords set in Google Ads that are used to show ads.
5. Landing pages: This report shows the URLs of the pages where visitors were directed from ads or keywords in Google Ads.
6. Ad performance: This report displays the performance of the ads set up in Google Ads that bring traffic to your site.
7. Performance by day of week: This report shows the amount of traffic generated by your ads on each day of the week. It combines data on clicks, costs and goal conversions.
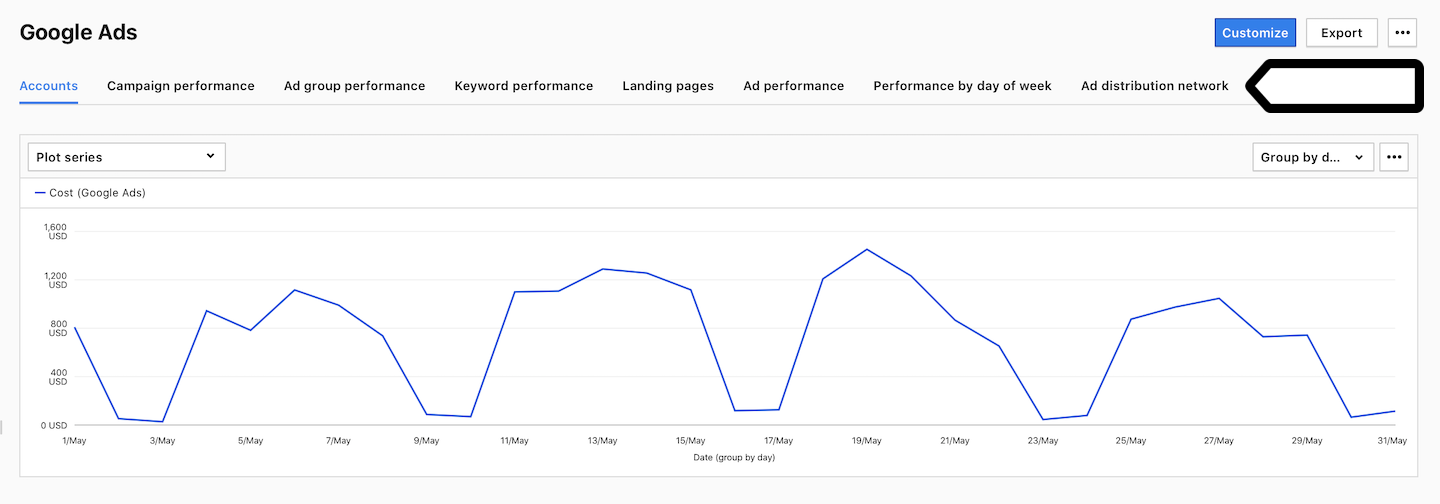
8. Ad distribution network: This report shows where your ad was displayed. The networks include content, mixed, search, search partners, unknown, unspecified, YouTube search and YouTube watch.
View the report
To view the Google Ads report, follow these steps:
1. Go to Menu > Analytics.
2. Navigate to Reports.
3. On the left, click Google Ads.
4. Voila! You can now view your report.
5. (Optional) Click a subreport name to view it.
6. (Optional) Click a section name to view a specific section of this report.
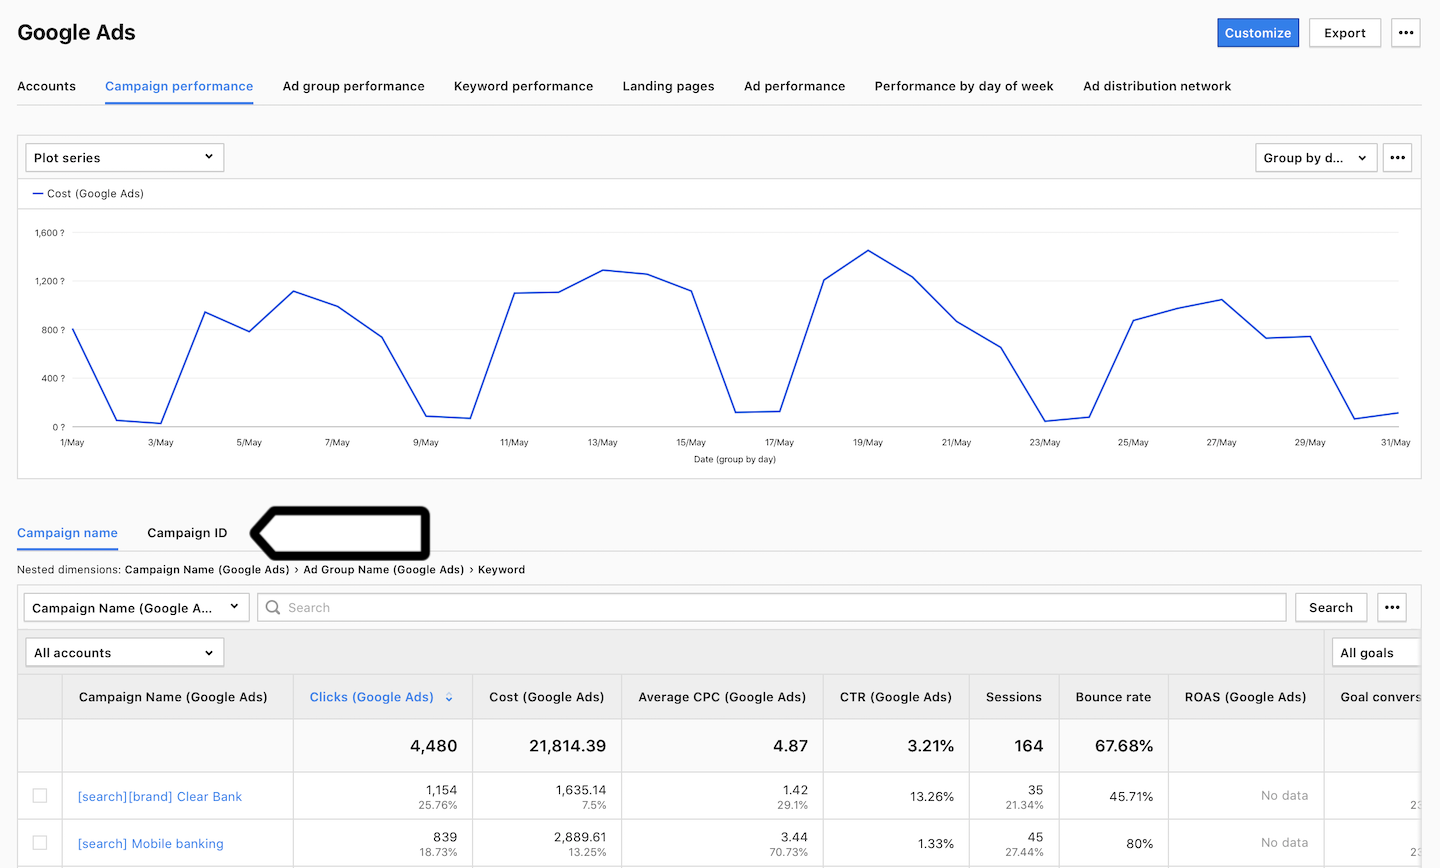
7. (Optional) If you come across a nested dimension in the report, simply click on the dimension to explore more detailed data.
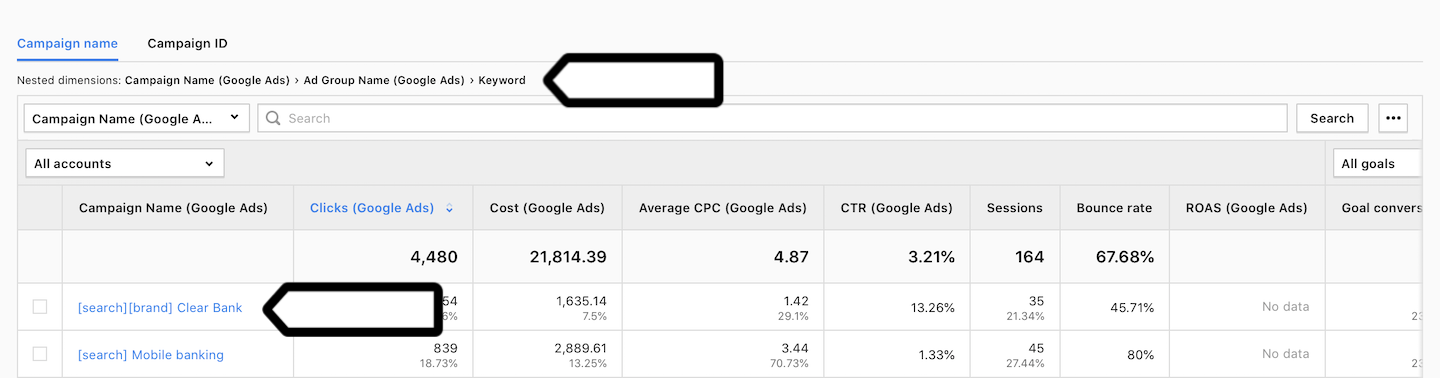
Note: The question mark (?) next to “cost” or “average CPC” in the Google Ads report means that the values are in different currencies. When you connect Google Ads accounts that use different currencies, the cost and average CPC figures become inaccurate. Piwik PRO is unable to convert currencies, so your reports will show combined values in different currencies.
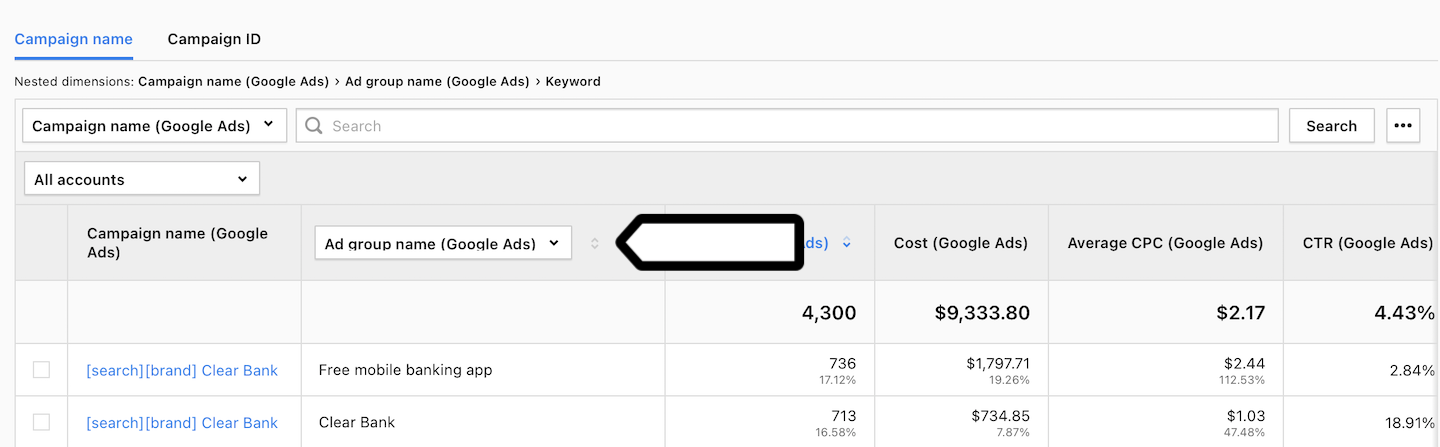
8. (Optional) If you want to see two dimensions in a single view, click + and choose a dimension.
Metrics in the report
The table below describes the metrics you’ll find in your Google Ads report.
| Metric name | Description |
|---|---|
| Clicks (Google Ads) | The number of clicks on your ad. |
| Cost (Google Ads) | The amount you paid for your ads in Google Ads. |
| Average CPC (Google Ads) | The average cost per click (CPC) is the amount you paid for your ad divided by the total number of clicks. Average CPC = (Cost / Click) * 100%. |
| CTR (Google Ads) | Click-through rate (CTR) measures how many times people click on your ad in Google Ads after it’s shown to them. CTR = (Clicks / Impressions) * 100%. |
| Sessions |
The number of sessions performed by visitors. A session starts with the first event and ends 30 minutes after the last event performed in that session. Note: Learn more about sessions. |
| Bounce rate |
The percentage of sessions in which visitors only viewed one page and didn’t proceed to another page, goal conversion or order. Note: Learn more about bounce rate |
| ROAS (Google Ads) | Return on ad spend (ROAS) shows whether your Google Ads ad spend has resulted in conversion revenue. ROAS = (Goal Revenue + Ecommerce Revenue) / Cost (Google Ads)) * 100%. |
| Goal conversions |
The number of goals completed in a session. Note: You need to set goals to collect this data. |
| Goal conversion rate |
The percentage of sessions in which visitors completed a goal. Note: You need to set goals to collect this data. |
| Sum of goal revenue |
The amount of revenue generated by a goal. Note: You need to set goals to collect this data. |
Note: You can customize this report, apply segments to it, export it to a CSV, XML, JSON or JSON (KV) file format or share it with your teammates.
Click vs. session data
Sometimes, you might notice that the number of clicks is much higher than the number of sessions. Here’s the reason why this can occur:
- No consent: When you use the consent form and choose not to collect data from visitors who don’t consent, session data of such visitors won’t be collected. For example, if a visitor clicks on an ad but doesn’t consent to collecting data, the session won’t be recorded.
- Closed tab: If a visitor clicks on an ad but closes the tab before the landing page has finished loading, no session data will be recorded.
- Many clicks on the same ad: If a visitor clicks on an ad multiple times within a 30-minute session, Google Ads will count each click, but Piwik PRO will still consider it as a single session.
Watch more tutorials on YouTube: